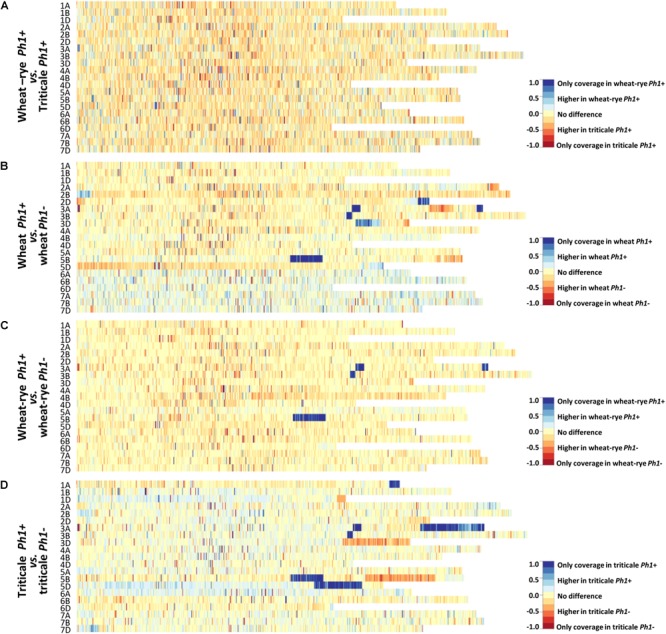
FIGURE 2.

Chromosome coverage plots generated using the obtained RNA-seq data. The ratio of coverage along all chromosomes was plotted as a heatmap. (A) Heatmap comparing wheat–rye hybrids and triticale, both containing the Ph1 locus (Ph1+). No global change in transcription was observed between these two genotypes. (B) Heatmap comparing wheat in the presence (Ph1+) and absence (Ph1–) of Ph1. (C) Heatmap comparing wheat–rye in the presence and absence of Ph1. (D) Heatmap comparing triticale in the presence and absence of Ph1. Several deletions (visualized in dark blue) and other chromosomes reorganizations were detected in all genotypes in the absence of Ph1 (B–D).
