FIGURE 3.

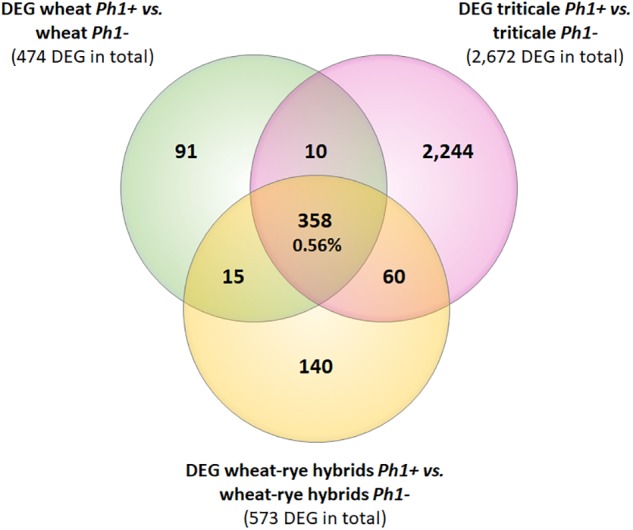
Venn diagram showing the overlapping DEGs common in all samples containing the Ph1 locus (Ph1+) vs. all samples lacking it (Ph1–). Only 358 genes were differentially expressed in all genotypes lacking Ph1.

Venn diagram showing the overlapping DEGs common in all samples containing the Ph1 locus (Ph1+) vs. all samples lacking it (Ph1–). Only 358 genes were differentially expressed in all genotypes lacking Ph1.