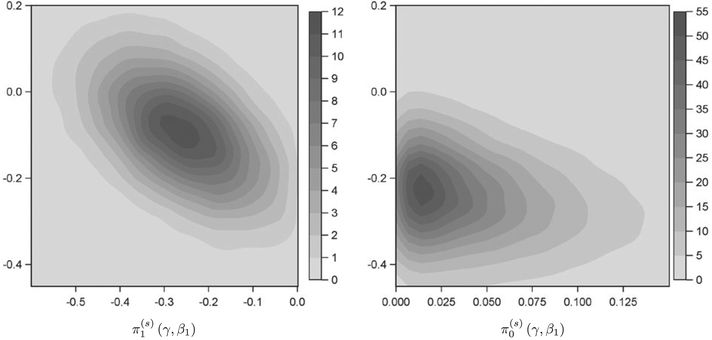
FIGURE 3.
Bivariate kernel density estimate for default alternative and null sampling priors. The horizontal axis corresponds to the treatment effect parameter γ, and the vertical axis corresponds to the intercept parameter β1 in the model for the cured fraction. The vertical axes are presented on the same scale to facilitate qualitative comparison of β1 values

