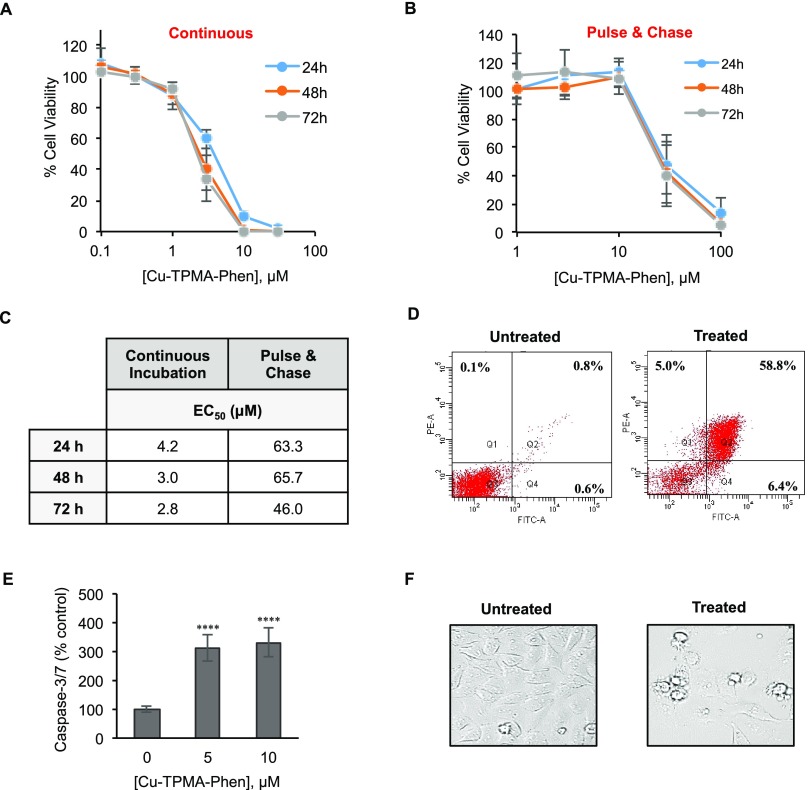
Figure 7.
Cytotoxic effect of Cu-TPMA-Phen on NB100 cells. (A) Cell viability curves for NB100 cells continuously exposed to different doses of Cu-TPMA-Phen for 24, 48, and 72 h. (B) Cell viability pulse and chase curves of NB100 cells exposed at various doses of Cu-TPMA-Phen for 2 h and then incubated in complete medium for 24, 48, and 72 h. Cell viability was measured by MTS assay and expressed as a percentage of untreated cells. The results in (A) and (B) are presented as mean ± SD of three independent experiments performed in triplicate. (C) Half-maximal effective concentration (EC50) values were calculated by nonlinear regression with standard slope analysis. (D) The cell death pathway triggered by 5 μM Cu-TPMA-Phen was evaluated on NB100 cells after 24 h of treatment by Annexin V/propidium iodide (PI) staining and flow cytometry analysis. Fluorescein isothiocyanate (FITC)-A channel is used for the detection of Annexin V–enhanced green fluorescent protein (EGFP) fluorescence. Phycoerythrin (PE)-A channel is used for the detection of PI fluorescence. Representative plots of Annexin V/PI staining are shown; apoptotic (Q4, Annexin V+/PI−), necrotic (Q1, Annexin V–/PI+), and late-stage apoptotic cells (Q2, Annexin V+/PI+). (E) Caspase 3/7 activation in NB100 cells exposed to 5 and 10 μM Cu-TPMA-Phen for 24 h. The expression of activated caspases is reported as a percentage of untreated cell values. Mean ± SD of three independent experiments, each in triplicate, are given. Statistical significance was determined by unpaired t test (**** p < 0.0001). (F) Morphological analysis of NB100 cells treated with 5 μM Cu-TPMA-Phen for 24 h, using phase contrast microscopy (400×).

