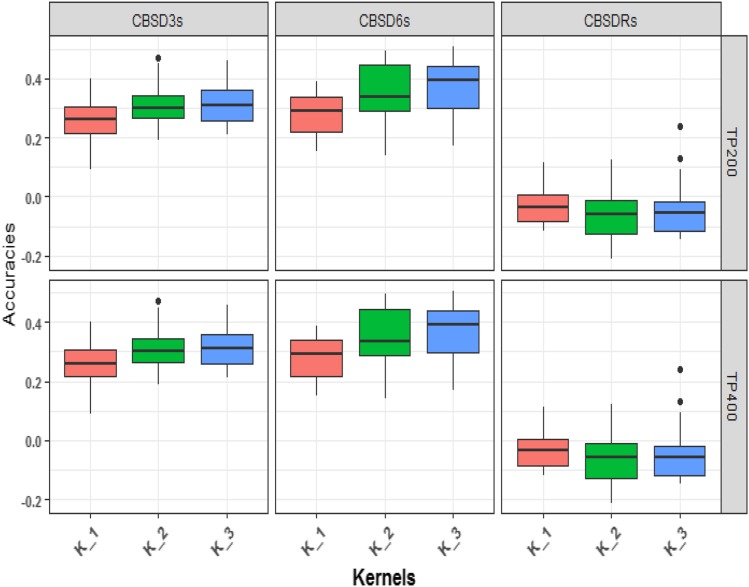
Figure 4.
G-BLUP model to compare prediction accuracies for varying number of kernels for CBSD measured at 3, 6 and 12 MAP for size of TP 400 and 200. K_1= Single kernel G-BLUP model. K_2= Multi-kernel G-BLUP, the first kernel is defined by combined markers from chromosomes 4 and 11. The second kernel is defined by the remaining markers. K_3= Multi-kernel G-BLUP, the first and second kernels are defined by markers from chromosomes 4 and 11 respectively, and third kernel is defined by the remaining markers.

