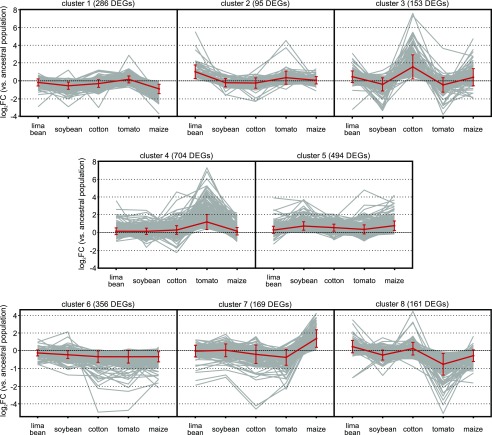
Figure 2.
- k-means clustering of the T. urticae DEGs upon the different long-term host plant transfers. Mite transcriptomic responses to the long-term host plant transfers were categorized into eight clusters using centered Pearson’s correlation as the distance metric. Clusters were arranged according to the magnitude of log2FC of the DEGs. Red lines connect the averages of log2FC of the different host plant populations within each cluster, with error bars representing the standard deviation.

