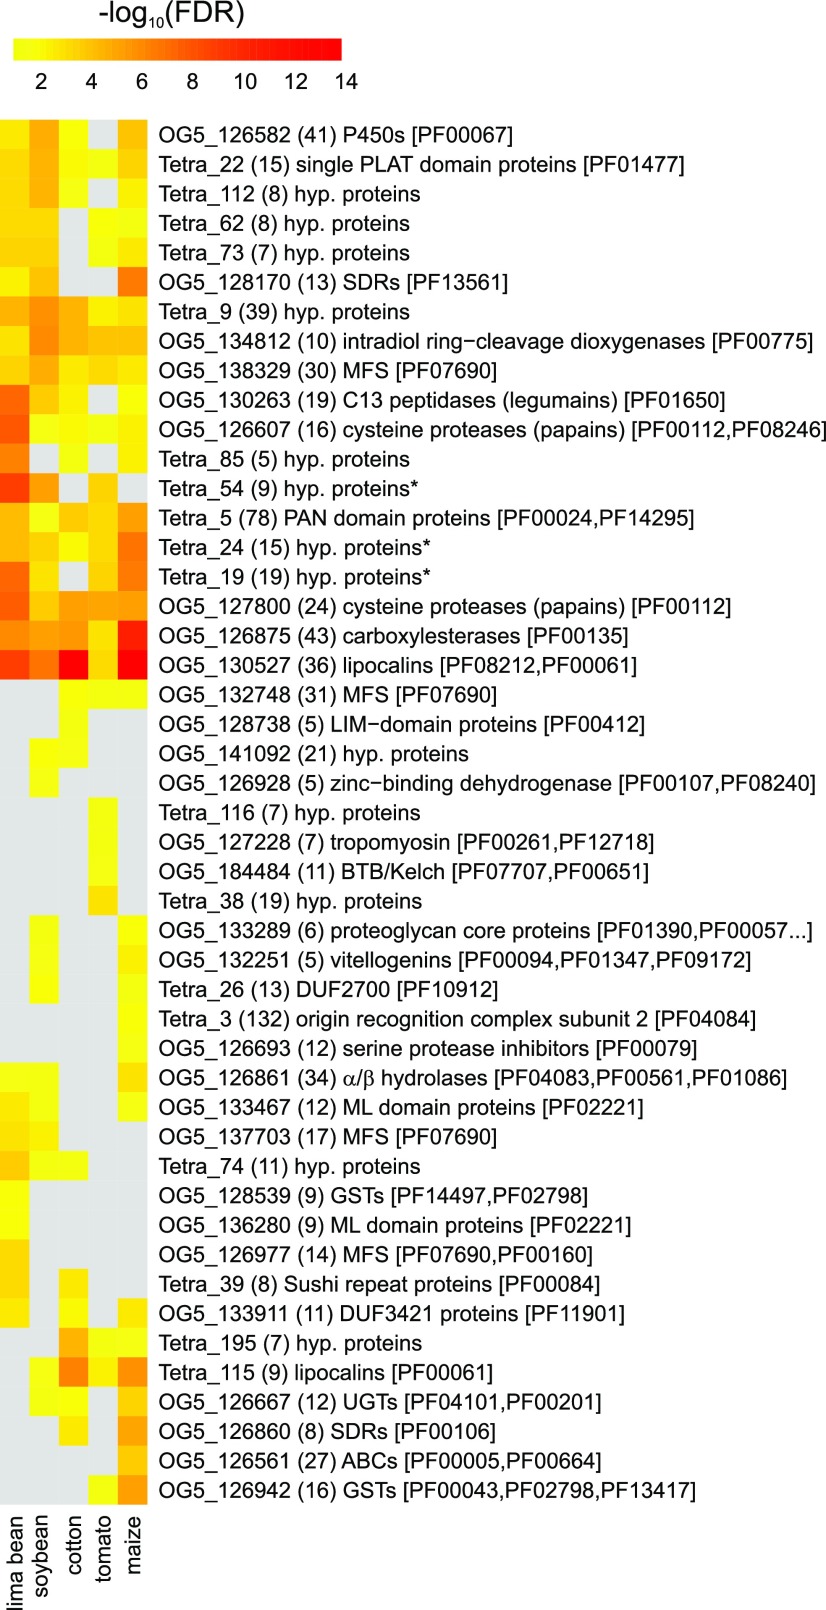
Figure 3.
- OrthoMCL enrichment analysis of the DEGs identified in the different host plant populations of T. urticae. Heatmap showing the Benjamini-Hochberg corrected p-value (FDR) significance of OrthoMCL groups among DEGs of each host plant population. A gray colored cell indicates that the OrthoMCL group was not significantly enriched (FDR ≥ 0.05) for a certain host plant population. The number between parentheses represents the total number of T. urticae genes in an OrthoMCL group (corrected for those genes that have probes on the array), while PFAM accessions associated with any of the genes in a certain OrthoMCL group are shown between square brackets. An asterisk indicates that members of these hypothetical protein OrthoMCL groups were found in the salivary proteome of T. urticae (Jonckheere et al. 2016).

