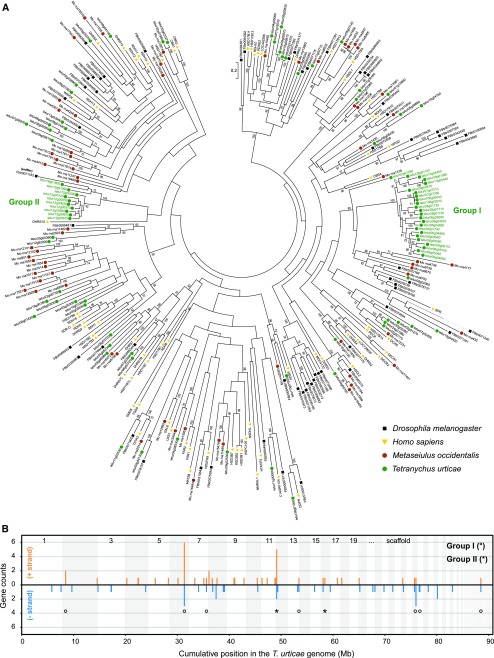
Figure 4.
- Maximum likelihood phylogenetic analysis and genomic distribution of T. urticae SDRs. (A) Maximum likelihood phylogenetic analysis of the SDRs of Homo sapiens, Drosophila melanogaster, Metaseiulus occidentalis and Tetranychus urticae. Only bootstrapping values higher than 65 are shown. The scale bar represents 0.2 amino acid substitutions per site. T. urticae SDR expansions containing members of OrthoMCL groups that were significantly enriched among one of the DEG sets of the host plant populations are indicated by green font and labeled as Group I (°) and Group II (*). Branches that were shortened for figure clarity are shown as dashed lines. Information and accession numbers of the used SDRs can be found in Table S7 and File S2. (B) Genomic distribution of T. urticae SDRs is shown with lengths of vertical line segments corresponding to counts in a gene cluster; gene counts for the forward (+, orange) and reverse (−, blue) strand orientations. Clusters of SDRs were calculated such that, for a given gene, its count contributes to only one vertical line segment. Only intact SDRs were included in the analysis. Genes of the expansions of Group I and II (see panel A) are marked with their respective symbol. The genome was concatenated from largest to smallest scaffolds for display, alternating scaffolds are indicated by shading.

