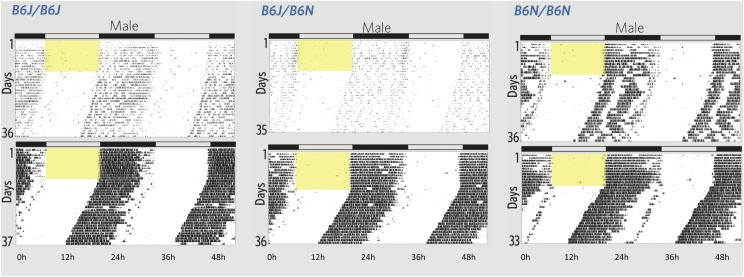
Figure 3.
Double-plotted actograms illustrate the variation in wheel running activity of male mice based on their genotype at rs30314218. On reading a single actogram: An actogram illustrates the activity of a single mouse over the course of an experiment. Each day of the experiment is represented by a histogram, with bin width of six minutes. Histograms are stacked vertically. Additionally, each day is shown twice (repeated horizontally) so that there is no time of day that is illegible due to the plot edges. Yellow box indicates when lights were on. On reading this six-actogram plot: Recall that the DGLM estimates a unique mean and standard deviation (SD) for each genotype. The mice whose actograms are shown here had an activity level that is one genotype-specific SD greater than (top) or less than (bottom) the genotype-specific mean. The difference between the two is much less in the C57BL/6N homozygotes than in the other genotypes, reflecting the decreased phenotype variance among C57BL/6N homozygotes. The animals shown in this figure are marked with large blue circles in Figure 2a. A larger figure that also includes female mice as well as the ID’s of all plotted mice are in the supplement (Figure S2 and Table 2).

