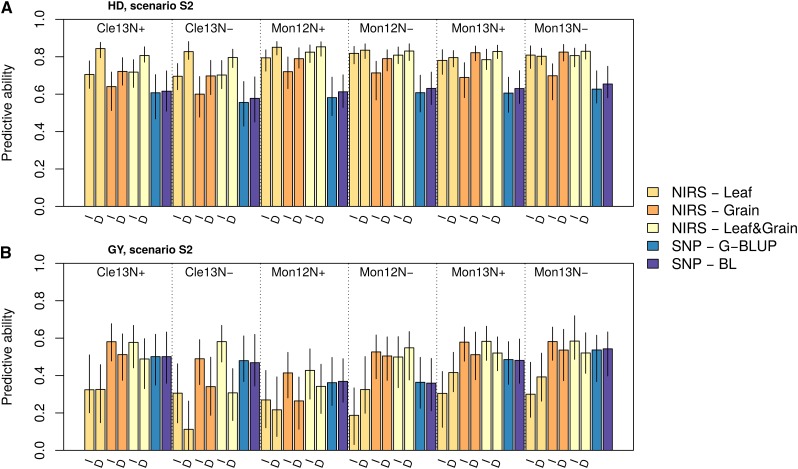
Figure 4.
Details of the predictive abilities obtained in scenario S2 for heading date (a) and grain yield (b) for wheat. In S2, the NIRS and phenotypic data used to train the RR-BLUP model were collected in distinct environments. The bars are labeled with the origin of the NIRS data (I: irrigated treatment, D: drought treatment). The medians of the predictive abilities obtained over repeated cross-validations are reported as the height of the bars together with the first and third quartiles as confidence intervals.

