Figure 2.
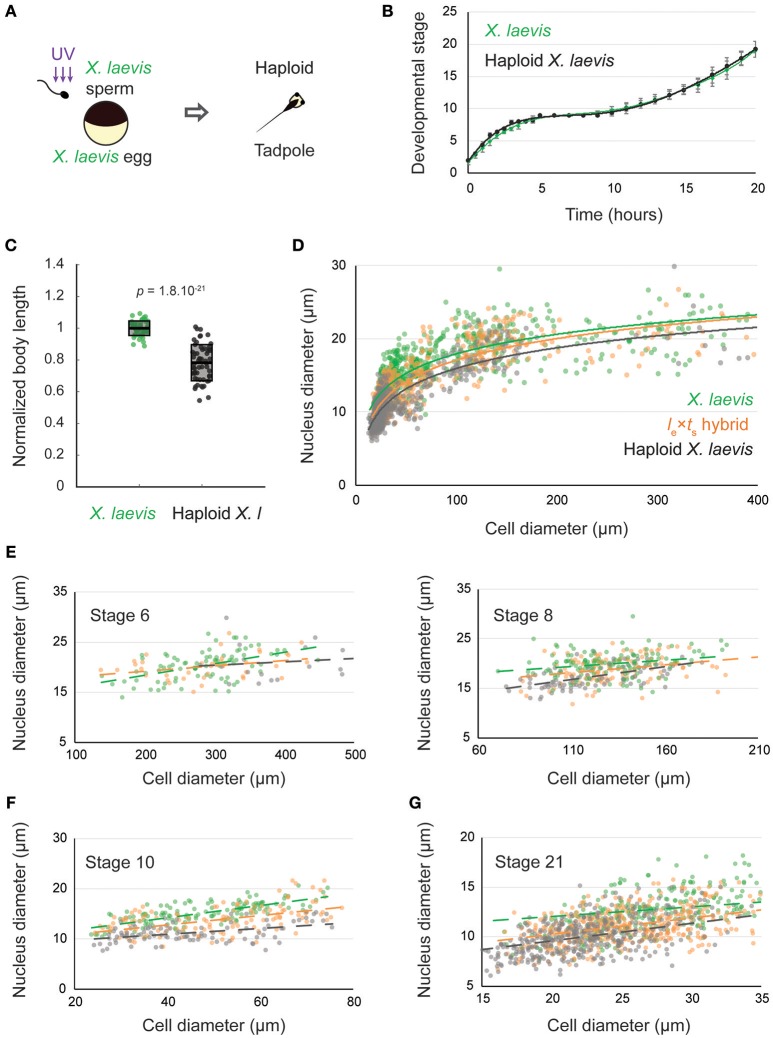
Nuclear to cell size relationships pre- and post-zygotic genome activation in le × ts hybrids compared to X. laevis diploids and haploids. (A) Schematic of generation of haploid X. laevis tadpoles via UV irradiation of sperm. (B) Developmental timing in X. laevis and haploid X. laevis embryos. Average is plotted for each time point. Error bars show standard deviation. (C) Body length of tailbud stage X. laevis and haploid X. laevis. Box plots show all individual body lengths. Thick line inside box = average length, upper and lower box boundaries = ± SD. P-value was determined by two-tailed heteroscedastic t-test. (D) Nuclear diameter vs. cell diameter in X. laevis, X. laevis haploid, and le × ts hybrid embryos. (E) Nuclear diameter vs. cell diameter in X. laevis, X. laevis haploid, and le × ts hybrid embryos at developmental stages 6 and 8. (F) Nuclear diameter vs. cell diameter in X. laevis, X. laevis haploid, and le × ts hybrid embryos at developmental stage 10. (G) Nuclear diameter vs. cell diameter in X. laevis, X. laevis haploid, and le × ts hybrid embryos at developmental stage 21. For (E–G), we ran an analysis of covariance (ANOCOVA test) to determine whether the nuclear to cell size scaling significantly depends on the embryo types. At stage 6, p = 0.132, at stage 8, p = 0.126, at stage 10, p = 2.558 × 10⁻⁶, and at stage 21, p = 1.110 × 10⁻⁷.

