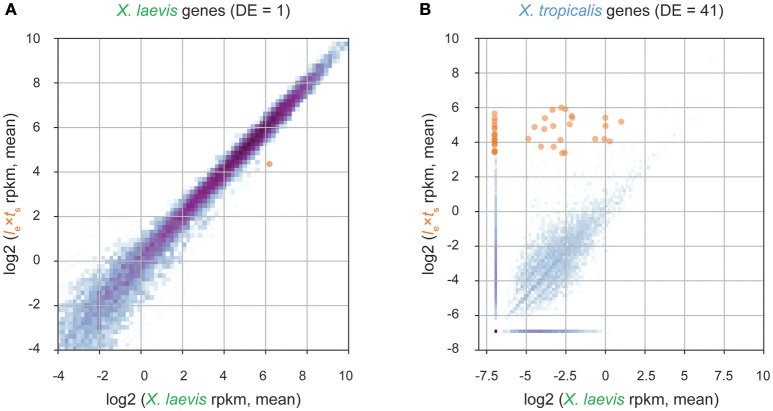
Figure 3.
Transcriptome analysis of le × ts hybrid embryos at the onset of zygotic genome activation. (A) Differential expression analysis of X. laevis maternal genes in stage 9 le × ts hybrid vs. X. laevis embryos. (B) Differential expression analysis of X. tropicalis paternal genes in stage 9 le × ts hybrid vs. X. laevis embryos. For both figures, RNA-seq reads are mapped to a database of combined X. laevis and X. tropicalis transcriptomes and significantly differentially expressed genes (DE; fold-change >2 and false discovery rate < 0.05) are marked in orange (see section Materials and Methods for more information).

