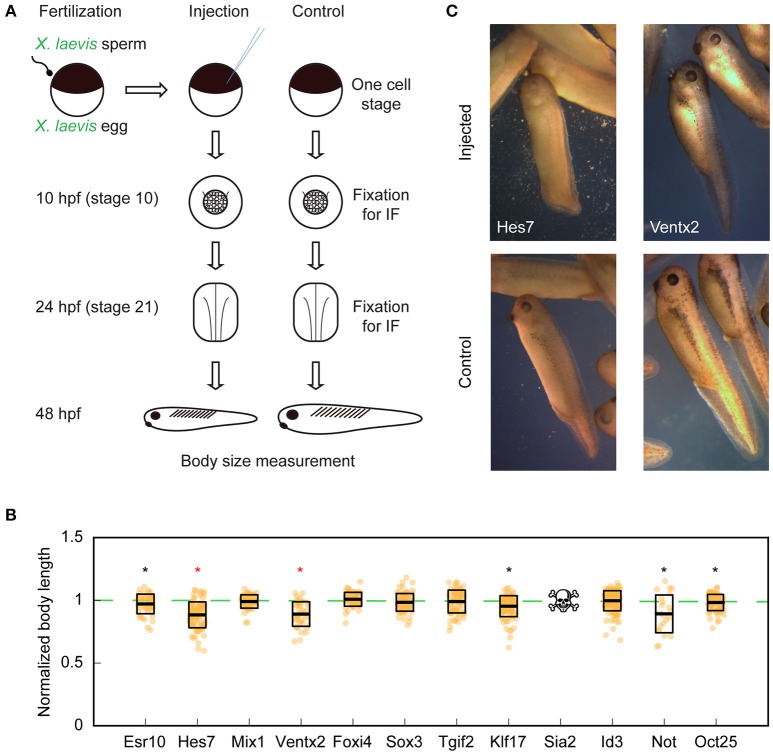
Figure 4.
Organismal size in X. laevis embryos upon overexpression of candidate X. tropicalis transcription factors. (A) Workflow of candidate scaling factor screen. (B) Body length of tailbud stage injected X. laevis embryos. Thick line inside box = average length, upper and lower box boundaries = ±SD. Stars indicate the significance of the pooled results of 3 experiments with p < 0.05 (two-tailed heteroscedastic t-test). Red coloring indicates significance of each 3 individual technical replicates with p < 0.05 (two-tailed heteroscedastic t-test). Reduced number of measured embryos in Not is due to the fact that, overall, 67.5% of injected-embryos exogastrulated, indicating a developmental defect. (C) Representative images of injected X. laevis embryos 48 h post-fertilization. Hes7- (left) and Ventx2-injected (right) are shown (top) with corresponding controls (bottom). Images are at identical scale.

