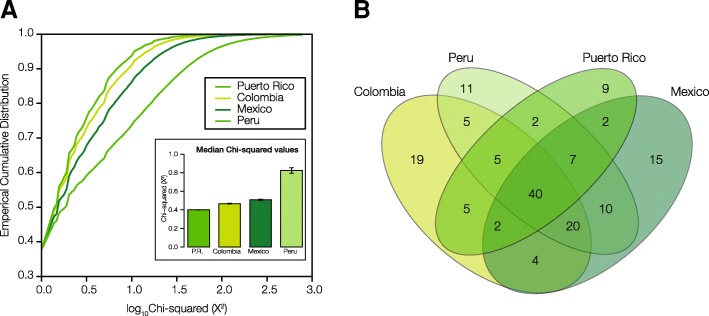
Fig. 3.
Ancestry-enriched SNPs in Latin American populations. An overview of the distributions of ancestry-enriched SNPs within and between the four admixed Latin American populations are shown, giving an indication of the overall numbers of ancestry-enriched SNPs along with the extent to which they are shared or unique to specific populations. a Cumulative distributions of ancestry-enrichment χ2 values for all SNPs in the four Latin American populations. Inset: Median χ2 values for each population ± standard error. b Venn diagram showing the number of genes with significant ancestry-enriched SNPs exclusive to one population and those shared by more than one population

