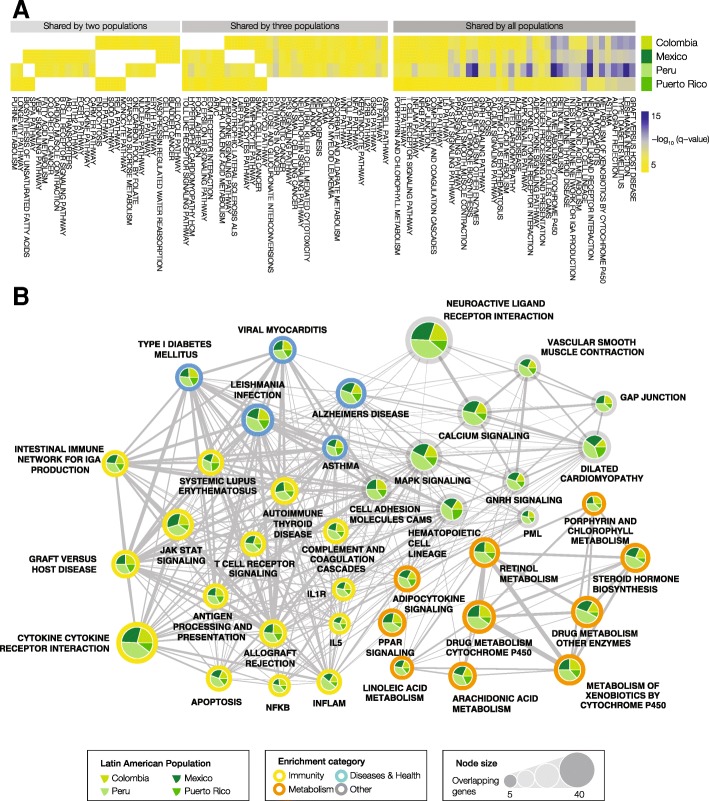
Fig. 4.
Gene set enrichment analysis of ancestry-enriched SNP genes. Functionally coherent gene sets and pathways that are overrepresented with respect to ancestry-enriched SNPs are shown, giving an indication of the kinds of health-related phenotypes that have been shaped by genetic ancestry in the four admixed Latin American populations. a Heatmap showing significantly enriched functional gene sets (i.e., pathways and phenotypes) shared by two, three or all four Latin American populations. The cells are color coded by the log transformed statistical significance (FDR q-value) of gene set enrichment analysis results. b Network showing significantly enriched pathways and phenotypes shared by all four Latin American populations. Nodes sizes represent the number of ancestry-enriched genes in each set. Pie charts show how many genes in a given set are from each population. Color coding describes the functional enrichment category as shown in the legend

