Fig. 2.

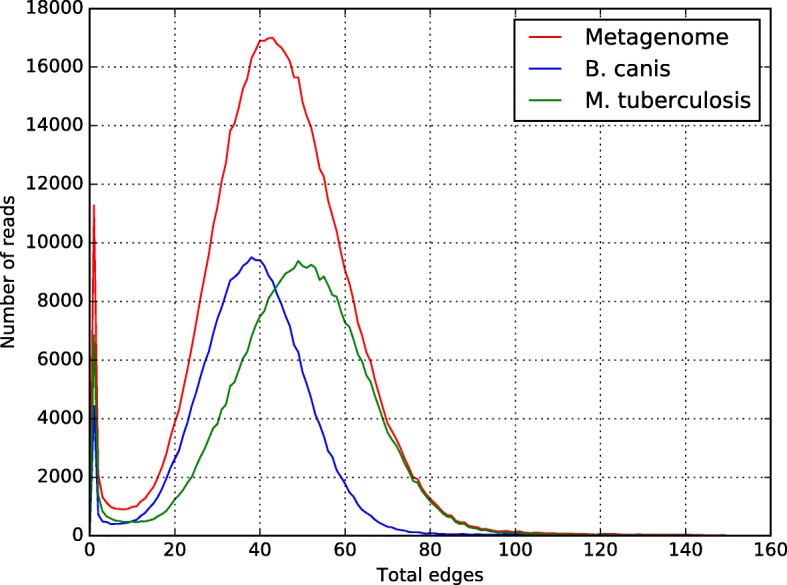
Number-of-edges histogram for the Brucella-Mycobacterium metagenome. The red line shows the metagenome histogram. The blue line shows the B. canis’ histogram and the green line shows the M. tuberculosis’ histogram

Number-of-edges histogram for the Brucella-Mycobacterium metagenome. The red line shows the metagenome histogram. The blue line shows the B. canis’ histogram and the green line shows the M. tuberculosis’ histogram