Fig. 4.
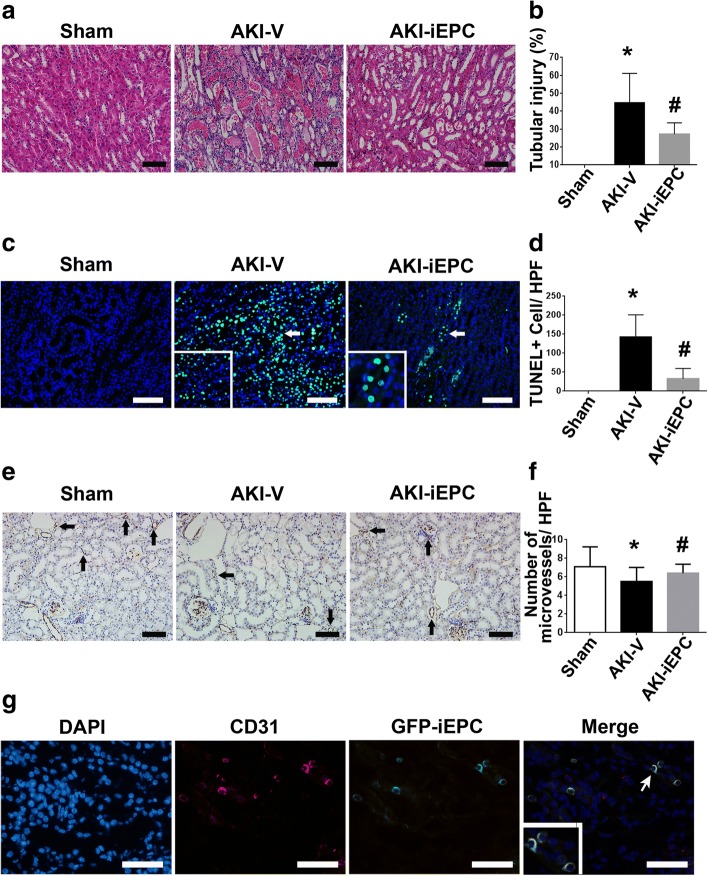
Systemic human iPS cell-derived iEPC therapy attenuated tubular injury and peritubular capillary rarefaction after acute kidney injury (AKI). a Representative hematoxylin and eosin-stained images depicting tubular injuries, including tubular necrosis, absence of nuclei, tubular dilatation, and intratubular cast, on day 2 after sham or AKI. b Bar chart representing semiquantitative analyses of tubular injury on day 2 after sham or AKI. N = 10 per group. c Representative immunofluorescence images of the detection of apoptosis through terminal dUTP nick-end labeling (TUNEL) staining on day 2 after sham or AKI. Arrows indicate TUNEL+ (green) nuclei (blue). d Bar chart representing quantitative analyses of the numbers of TUNEL+ apoptotic cells per high-power field (× 200 magnification) on day 2 after sham or AKI. N = 8 per group. e Representative immunohistochemical images depicting the staining of CD31+ endothelial cells on day 2 after sham or AKI. Arrows indicate CD31+ staining (brown). f Bar chart representing quantitative analyses of the number of microvessels per HPF on day 2 after sham or AKI. N = 10 per group. Data are expressed as mean ± SEM. *P < 0.05 AKI-V vs. Sham, #P < 0.05 AKI-iEPC vs. AKI-V group. Scale bar = 100 μm. g Representative immunofluorescence images depicting recruited GFP-iEPCs expressing human CD31 on day 2 after AKI. Arrow indicates a GFP-iEPC expressing CD31. Scale bar = 50 μm

