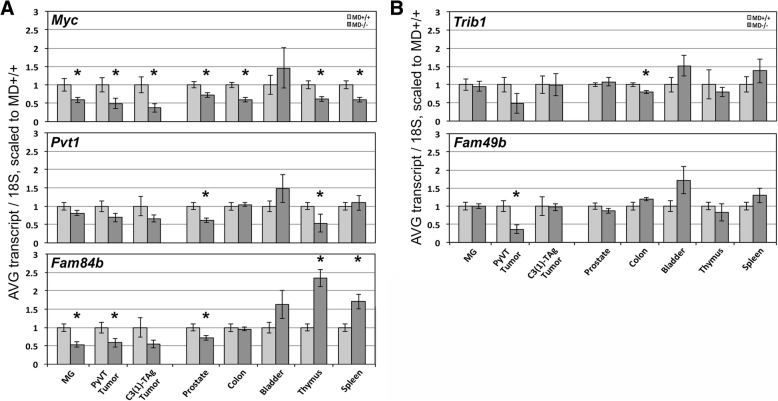
Fig. 7.
Gene expression analysis by quantitative real-time PCR (Q-PCR). (a) Transcript levels of Myc, Pvt1 and Fam84b. Samples from mammary gland (MG, MD+/+ n = 19, MD−/− n = 21), MMTV-PyVT-induced mammary tumor (MMTV-PyVT;MD+/+ n = 9, MMTV-PyVT;MD−/− n = 12), C3(1)-TAg-induced mammary tumor (C3(1)-TAg;MD+/+ n = 9, C3(1)-TAg;MD−/− n = 6), prostate (MD+/+ n = 21, MD−/− n = 18), colon (MD+/+ n = 7, MD−/− n = 10), bladder (MD+/+ n = 7, MD−/− n = 10), thymus (MD+/+ n = 20, MD−/− n = 17) and spleen (MD+/+ n = 26, MD−/− n = 25) were used. (b) Transcript levels of Trib1 and Fam49b. * = p < 0.05

