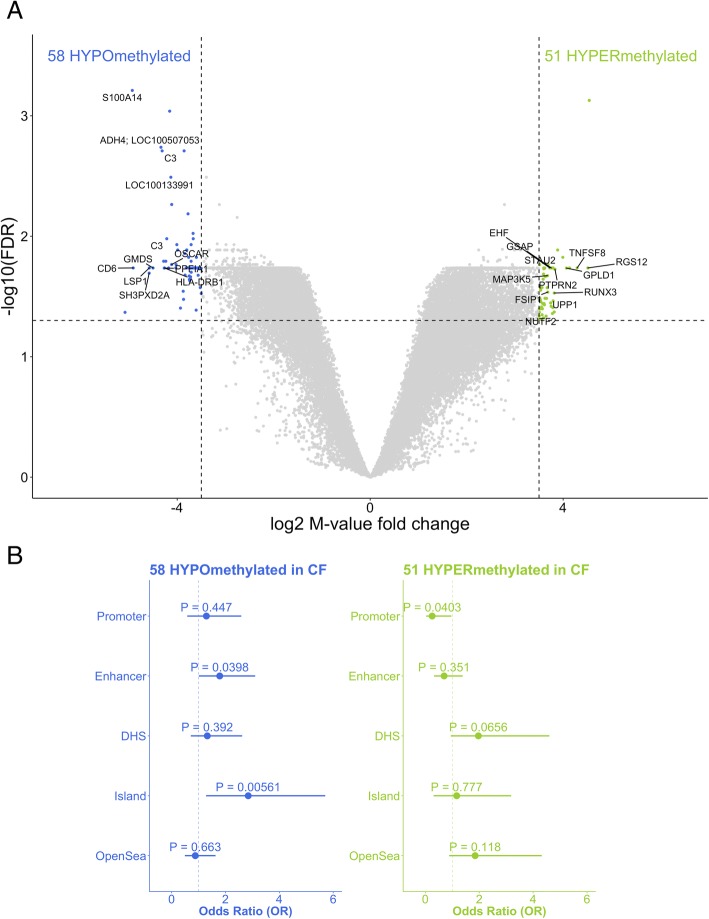
Fig. 4.
Epigenome-wide differential methylation in CF. Comparative analysis of DNA methylation in CF and healthy subjects identified 109 differentially methylated CpGs (FDR P < 0.1, a). CpG hyper-methylated in CF compared to controls (green) and hypo-methylated CpGs (blue) are plotted as log2 fold increase or decrease in methylation M value (x-axis) versus log10 FDR-adjusted P value (y-axis). Statistically significant CpGs associated with specific genes are labeled, and unlabeled points represent CpGs associated with no known gene at that location. Enrichment of differentially methylated CpGs to genomic and transcriptional context is shown in forest plots (b), illustrating that hypo-methylated CpGs in CF BAL are enriched for enhancer regions and CpG islands and that hyper-methylated CpGs in CF BAL are under-represented for gene promoter regions

