Fig. 1.
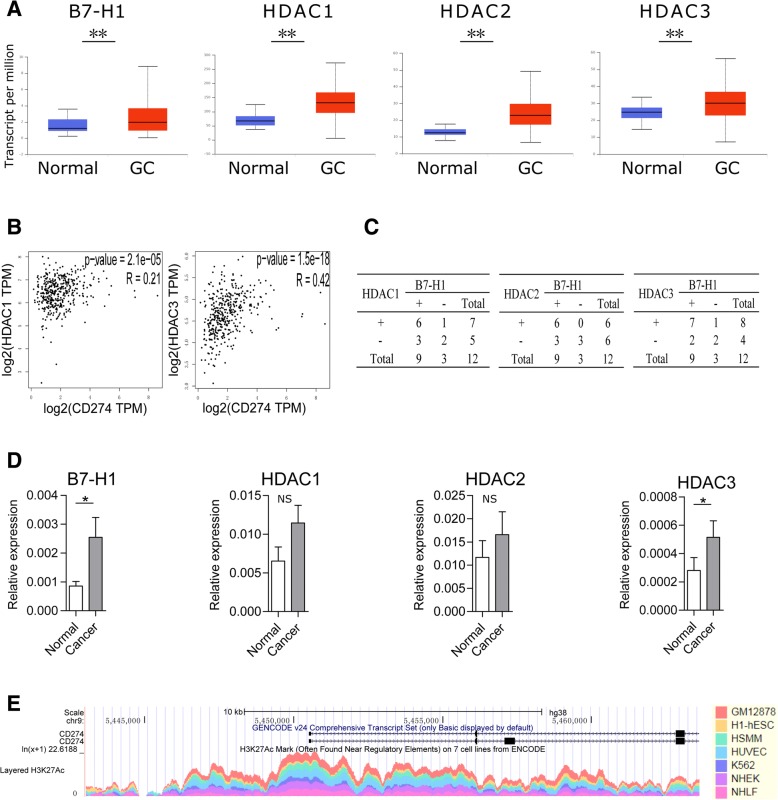
B7-H1 expression is correlated with HDAC in GC. a B7-H1 and HDAC1–3 expression was compared between normal gastric tissues (n = 34) and primary GC tissues (n = 415) from RNA-seq data of TCGA. The results were presented in box-and-whisker plots (median values (line), 25th–75th percentiles (box outline) and minimum and maximum values (whiskers)). b Spearman correlation analyses of B7-H1 and HDACs were performed using GC RNA-seq data of TCGA. c B7-H1 and HDAC1–3 protein expression was compared between 12 paired GC tissues and cancer-adjacent tissues collected from our institution. Shown were expression change between each pair of cancer and adjacent tissue. +, expression upregulation in cancer; −, expression downregulation in cancer. d B7-H1 and HDAC1–3 mRNA expression was compared between 12 paired GC tissues (cancer) and tumor-adjacent tissues (normal) collected from our institution. e H3K27Ac level in B7-H1 gene promoter region was assessed in seven cell lines using ChIP-seq data from ENCODE. *p < 0.05, **p < 0.001. NS, not significant

