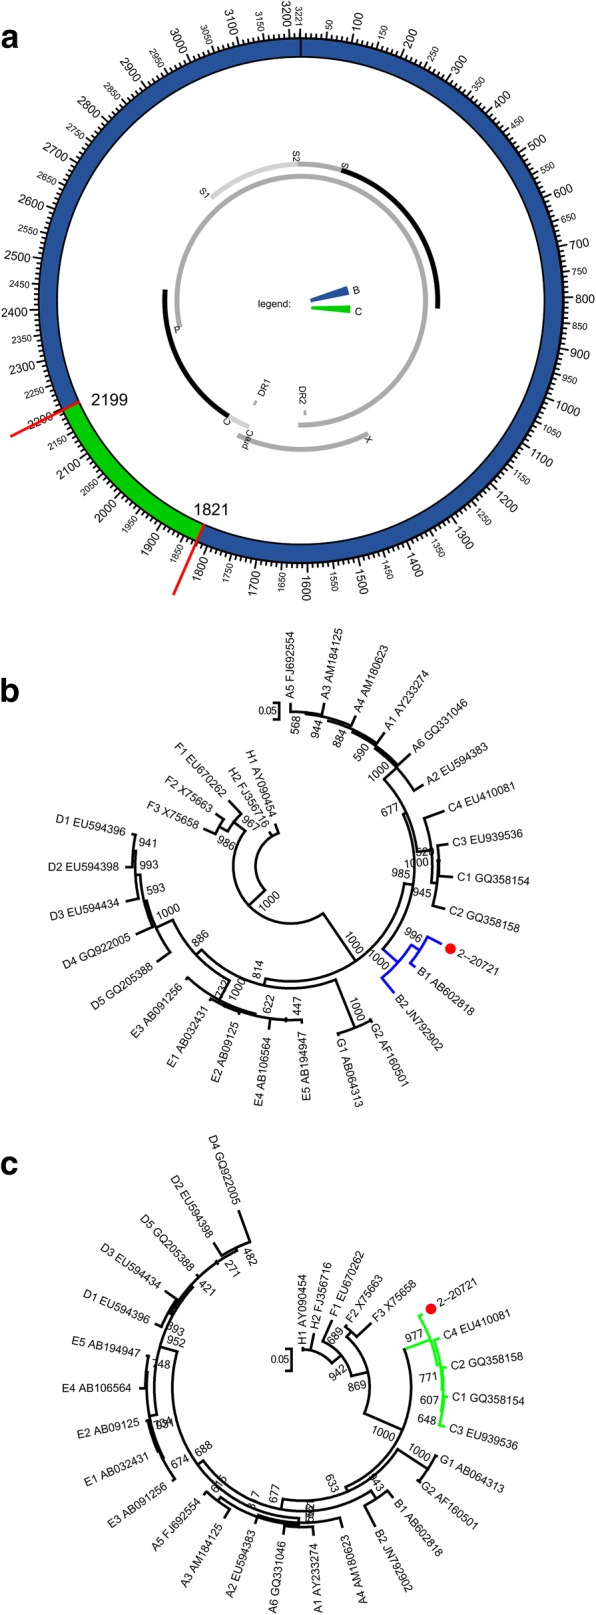
Fig. 2.

The RDP-derived mosaic structure and confirmation by sub-region phylogenetic trees. a The RDP-derived mosaic structure. The predicted genotype recombination is represented in the ring. The predicted breakpoints are displayed. P, C, S, and X indicate polymerase, core, surface, and X genes. b ML (GTR + I + G4) phylogenetic tree of regions derived from major parent (1–1820 and 2200–3215 of the strain). c ML (GTR + G4) phylogenetic tree of regions derived from minor parent (1821–2199 of the strain).Phylogenetic trees were constructed using the PhyML 3.0 implemented in RDP4 . The reliability of the phylogenetic tree analysis was assessed by bootstrap resampling with 1000 replicates. Genotypes and GenBank accession numbers are indicated. Values at the nodes indicate the bootstrap numbers by which the cluster was supported. Branch lengths are drawn to scale
