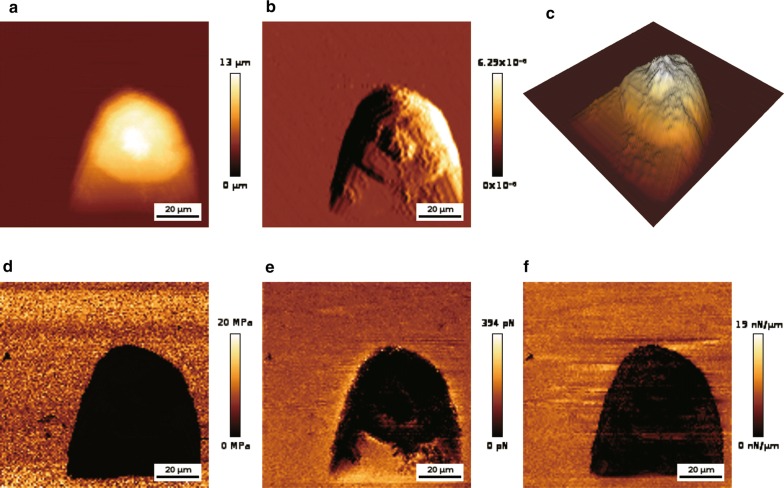
Fig. 4.
Imaging of cancer cell morphology and measuring the mechanical properties of cancer cells by AFM. a Representative AFM height image. b Representative AFM deflection image. c 3D distribution of cell height. The force curve is used to calculate mechanical properties. d Image representing Young’s modulus distribution. e Image representing adhesion force distribution. f Image representing stiffness distribution. Parameters are displayed as colors. The results of morphology observation and mechanical properties measurement of the cell were from our study group

