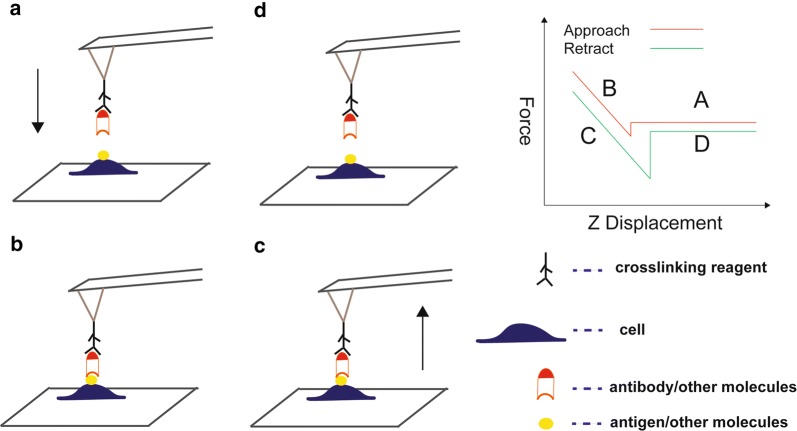
Fig. 5.
Schematic diagram of AFM-based single-molecule force spectroscopy. a Individual antibodies or other molecules immobilized on a functionalized tip are positioned above a cell adhering to a substrate. b Sample and tip molecules are then brought into contact for a defined contact time and with a preset contact force. c The molecules are subsequently separated, and the maximal separation force and the detachment work can be determined using a simultaneously recorded force–distance curve. d The cantilever is retracted until the tip and sample molecules separate

