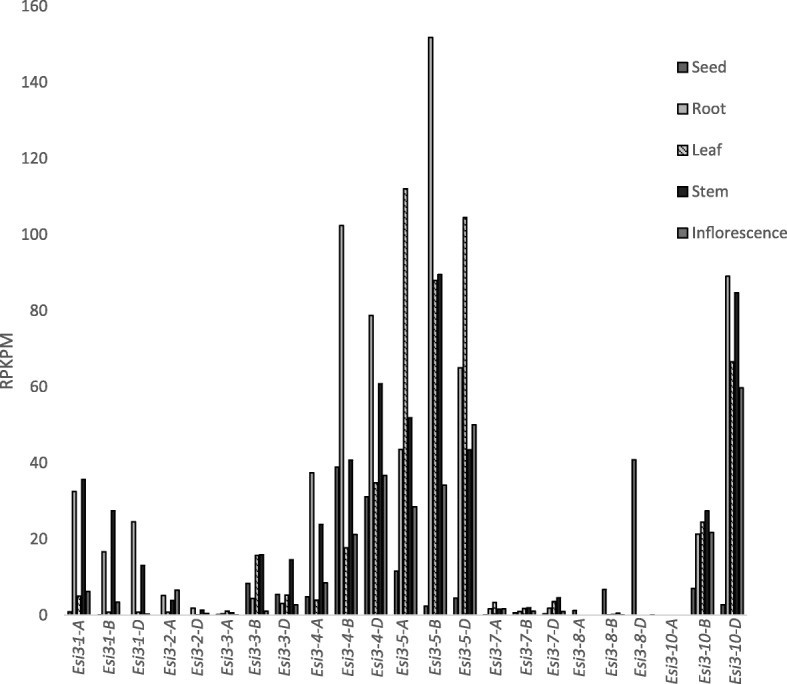
Fig. 1.

Tissue-specific gene expression. Esi3 gene expression in tissues of T. aestivum, the tissues analyzed included the seed at the whole plant ripening stage, the root at the cotyledon emergence stage, the leaf when the seed was 30 to 50% developed, the stem at the two nodes or internodes visible stage, and the inflorescence when maximum stem length was reached. Esi3–6 and Esi3–9 are not graphed because the RPKPM values were lower than 1.0 across all tissue types for all homeologous copies. Quantification is from RNA-seq data and values were normalized to reads per kilobase per million (RPKPM)
