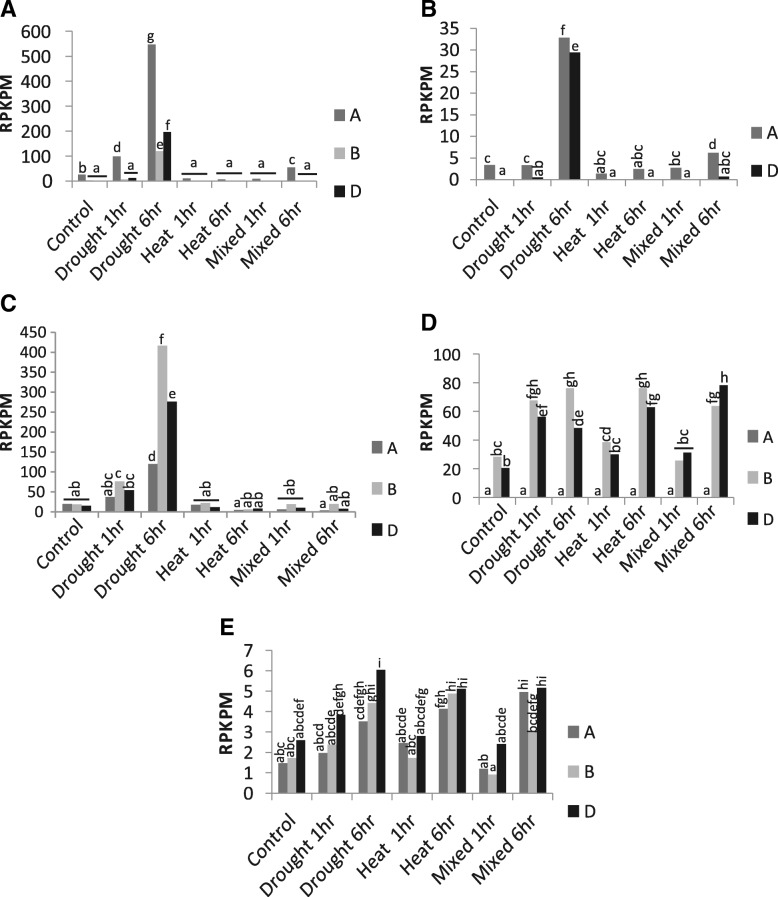
Fig. 2.
Short term osmotic and heat stress. Esi3 gene expression in seedling leaves in response to drought, heat, and combined drought and heat at 1-h and 6-h treatment times. Measurements are based on RNA-seq data. Gene expression differences for a Esi3–1, b Esi3–2, c Esi3–3, d Esi3–4, and e Esi3–7 are represented in reads per kilobase per million (RPKPM). Esi3s with significant expression changes are shown. Letters signify Duncan’s multiple range values

