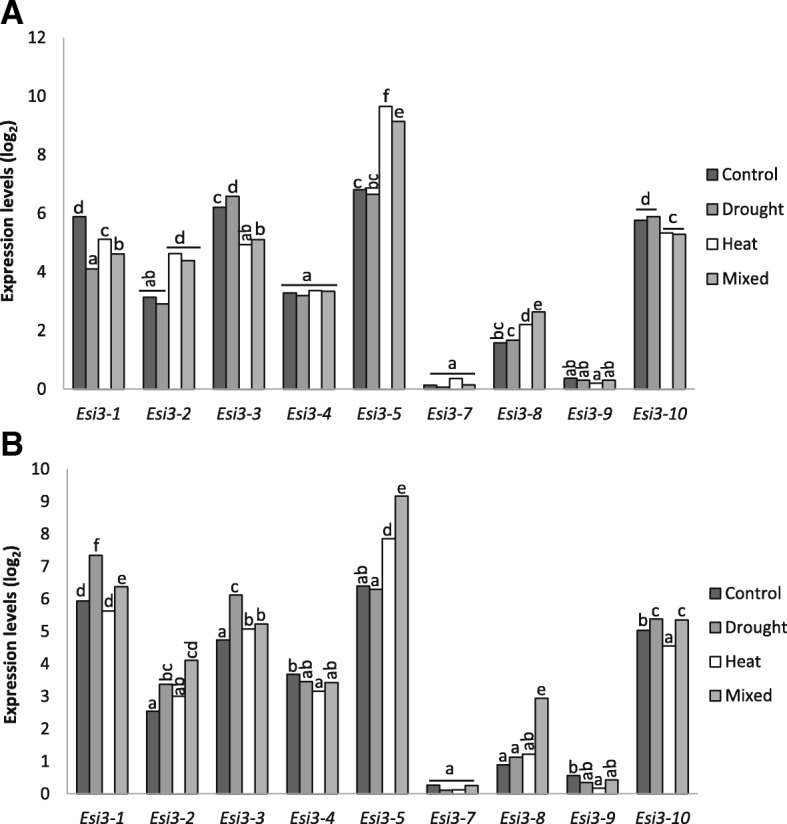
Fig. 3.

Long term drought stress. Esi3 expression in response to drought, heat and both stresses combined compared between (a) Cappelli an efficient water use line and (b) Ofanto a water use inefficient line. Data is from Affymetrix microarray analysis. Values are in log2 units, thus an increase by 1 unit represents a two-fold increase, background of 3.4 subtracted from each value. Conditions were those described in Aprile et al., 2013 [31]; in brief, plants were stressed at booting stage by withholding water to 12.5% soil water content. Heat treatment was done by incremental increases to 40 °C, and the combined treatment used the same two conditions. Letters signify Duncan’s multiple range values
