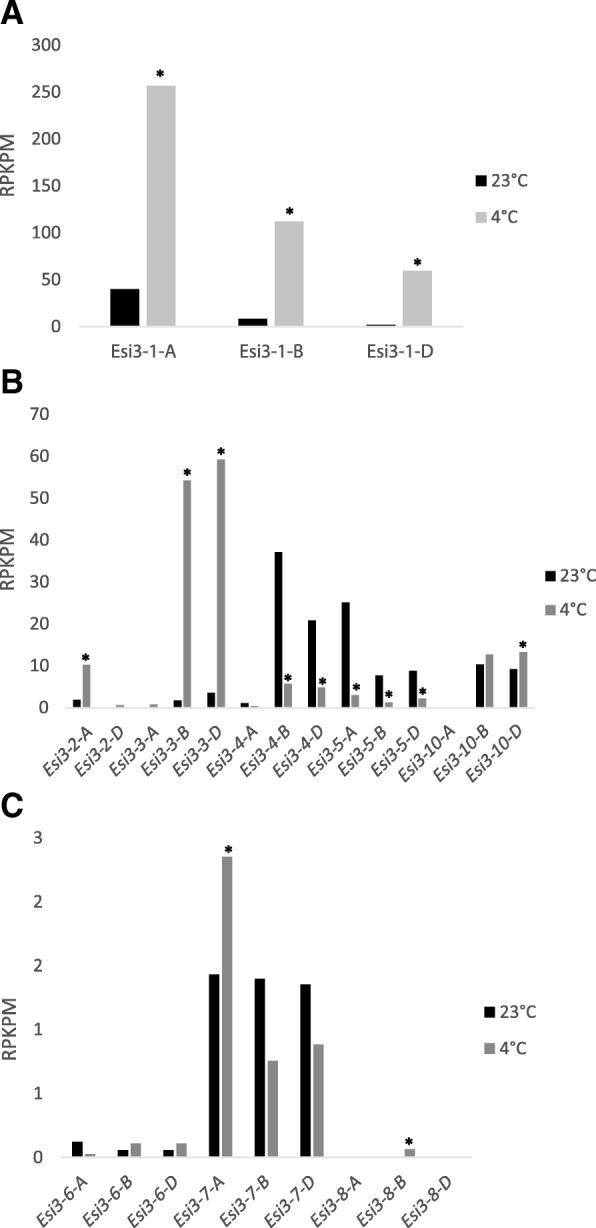
Fig. 5.

Short term cold treatment. Gene expression changes in Esi3 in response to cold treatment at 4 °C. (a) Esi3–1, (b) Esi3–2, −3, −4, -5, and −10 (c) Esi3–6, −7, and −8 expression in response to cold treatment. The Esi3s are separated into three graphs due to large differences in gene expression corresponding to large differences in Y-axis values. Esi3–9 is not graphed since there was no gene expression detected. * indicates significant changes in gene expression determined by a one-way ANOVA. Values are normalized to reads per kilobase per million (RPKPM)
