
Fig. 2.
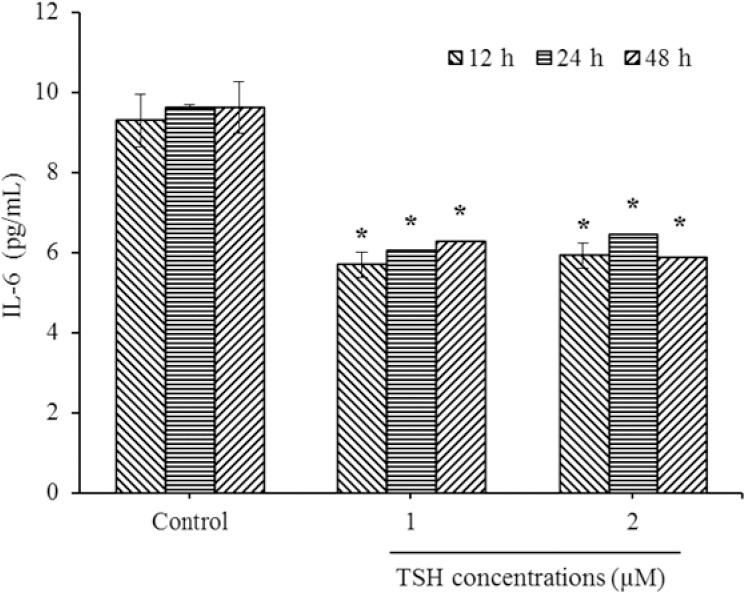
Down regulation of interleukin-6 (IL-6) levels in HUVECs by thyroid-stimulating hormone (TSH) exposure. After treatments with TSH (1 and 2 μM) for 12, 24, and 48 h, protein expression evaluated by ELISA method. * Indicates significant differences (P< 0.05) compared to control group. Data presented as mean ± SD values derived from three independent experiments.