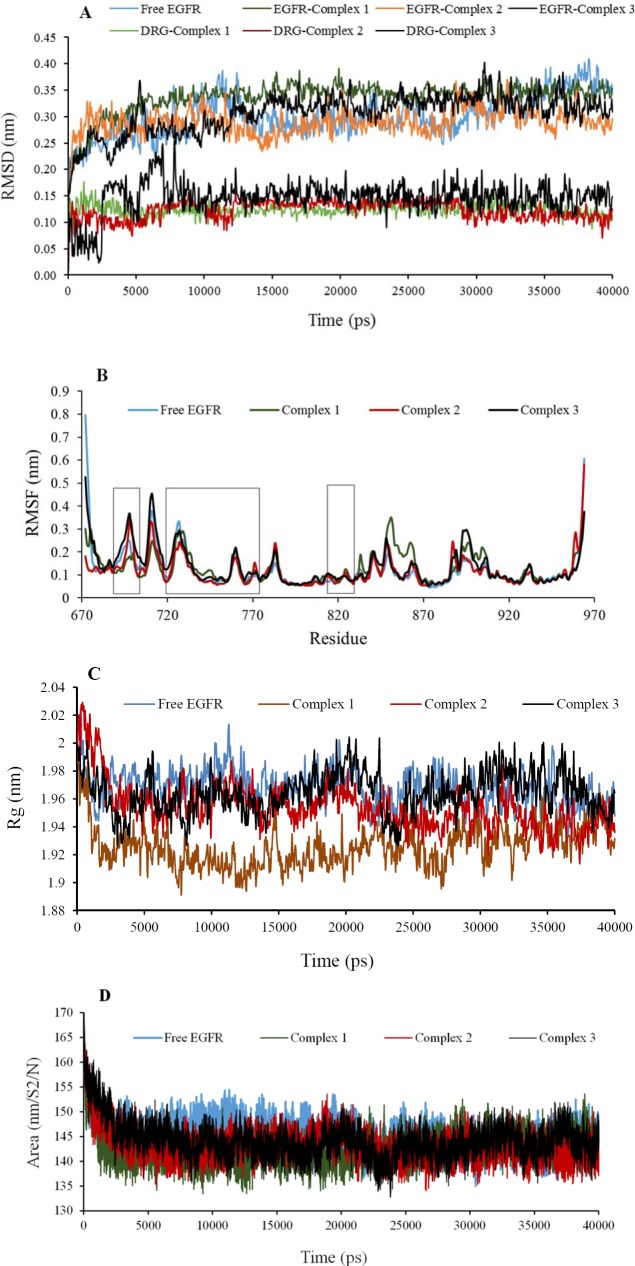
Fig. 1.
Analysis plots of the protein backbone and ligands structures for free epidermal growth factor receptor (EGFR), complex 1, 2, and 3 during 40 ns molecular dynamic simulation; A, the root mean square deviations (RMSD) plot; B, root mean square fluctuation (RMSF) plot; C, radius of gyration (Rg) plot; D, solvent accessible surface (SASA) plot.

