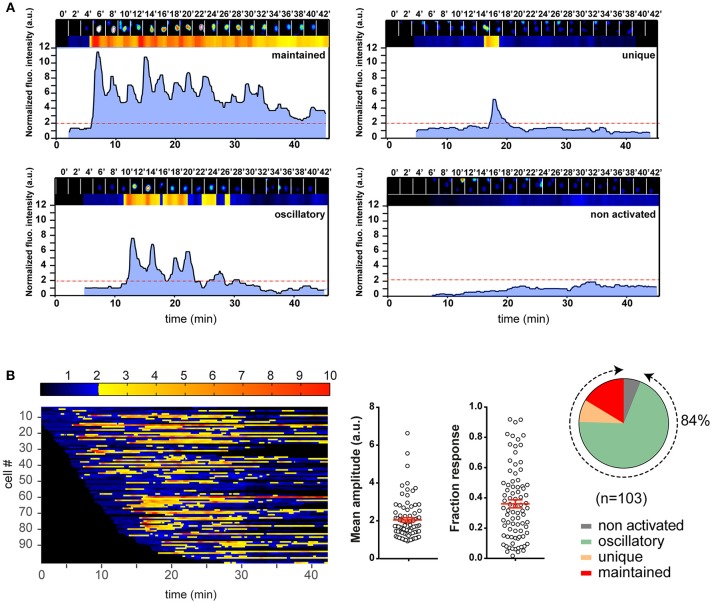
Figure 2.
Illustration of the T cell calcium response analysis with an example experiment. Naive 3A9 TCRtg CD4+ T cells were loaded with Fluo-4 PBX before incubation at 37°C for 45 min with COS-Ak pulsed with 10 μM HEL 48–63. Time-lapse movies of T cells were made using confocal microscope as described in Materials and Methods. (A) Single cell fluorescence recordings analyzed by MAAACS and categorized into different classes according to the magnitude and shape of fluorescence signals. The examples of four different response types are shown. In each panel, the top row is made up of 2 min-delayed snapshots of raw images of a cell. Just below are the normalized fluorescence intensities displayed in the form of a bar code and a line profile, respectively. The non-activated cells are defined as cells whose normalized fluorescence intensities have never reached the activation threshold (set at 2.0, red dotted line, see Methods and Materials for more details) along the whole trace. For the activated cells, we defined a response as “maintained” when the response fraction (RF) was higher than 0.8, and “unique” when the response fraction was lower than 0.2 with a single burst. In all other situations, calcium responses were “oscillatory.” (B) Color barcoding and calculation of the analytical parameters of the calcium response. The normalized fluorescence amplitude of each cell is plotted along a horizontal line as a function of time with a color-coded intensity (dark to blue below the threshold of activation and yellow to red above the threshold of activation). The analytical parameters of the calcium response, i.e., the mean amplitude (MA) and RF calculated by MAAACS are plotted (mean ± SEM). The global overview of the cell response heterogeneity is summarized in the form of a pie chart.

