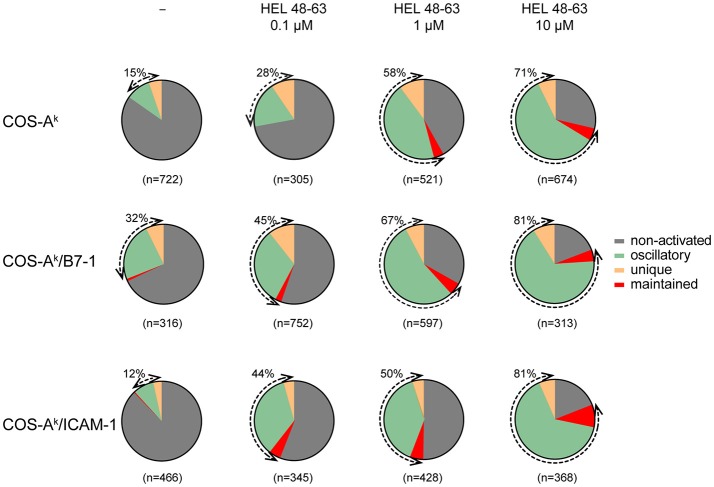
Figure 3.
Naive CD4+ T cells show various calcium response modes upon different stimulation. Naive 3A9 TCRtg CD4+ T cells were loaded with Fluo-4 PBX before incubation at 37°C for 45 min with COS APC cells pulsed without or with different doses of HEL 48–63 as indicated. Time-lapse movies of T cells were made by confocal microscope as described in Materials and Methods. For each antigenic peptide concentration, modes of calcium response are represented as a pie chart: non-activated in gray, maintained in red, oscillatory in green, and unique in yellow. The total number of cells analyzed is indicated in parentheses. The percentage of activated (reacting) cells is shown by the double arrows, and their values are indicated.

