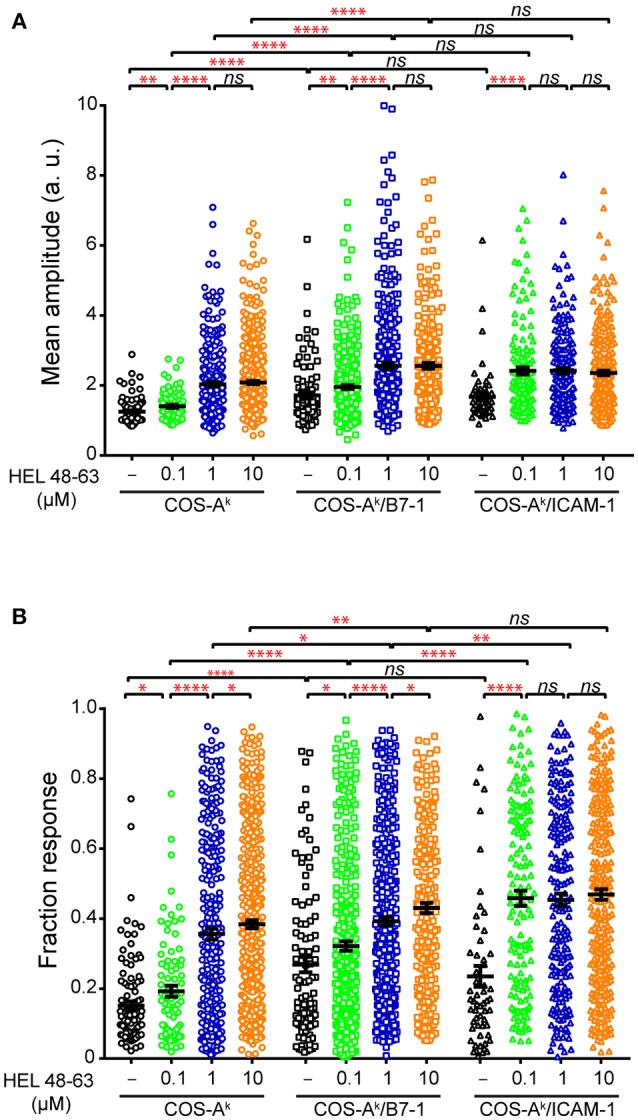
Figure 4.

Comparisons of analytical parameters of the calcium response in naive CD4+ T cells upon different stimulation. Naive 3A9 TCRtg CD4+ T cells stained with Fluo-4 PBX were loaded onto COS APC monolayers at 37°C and observed for 45 min. COS-Ak, COS-Ak/B7-1, COS-Ak/ICAM-1 APCs were loaded or not with 0.1, 1, and 10 μM HEL 48–63. Average mean amplitude (A) and responding fraction (B) were calculated as described in Materials and Methods. Data: mean ± SEM. Mann–Whitney tests were performed using Graphpad prism 7.0 for comparisons between two groups. Statistical significance was set at 0.05, and p-values < 0.05 were denoted in red. *p < 0.05, **p < 0.01, and ****p < 0.0001.
