
Figure 5.
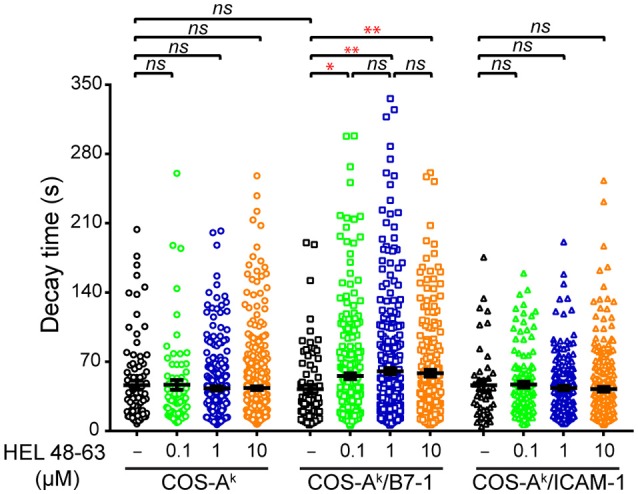
Comparisons of decay time (τ) of calcium response in naive CD4+ T cells upon different stimulation. Naive 3A9 TCRtg CD4+ T cells stained with Fluo-4 PBX were loaded onto COS APC monolayers at 37°C and observed for 45 min. APC cells were loaded or not with 0.1, 1, and 10 μM HEL 48–63. Analysis of average decay time (τ) was performed as described in Materials and Methods. Data: mean ± SEM. Mann–Whitney tests were performed using Graphpad prism 7.0 for comparisons between two groups. Statistical significance was set at 0.05, and p-values < 0.05 were denoted in red. *p < 0.05 and **p < 0.01.