Figure 2.

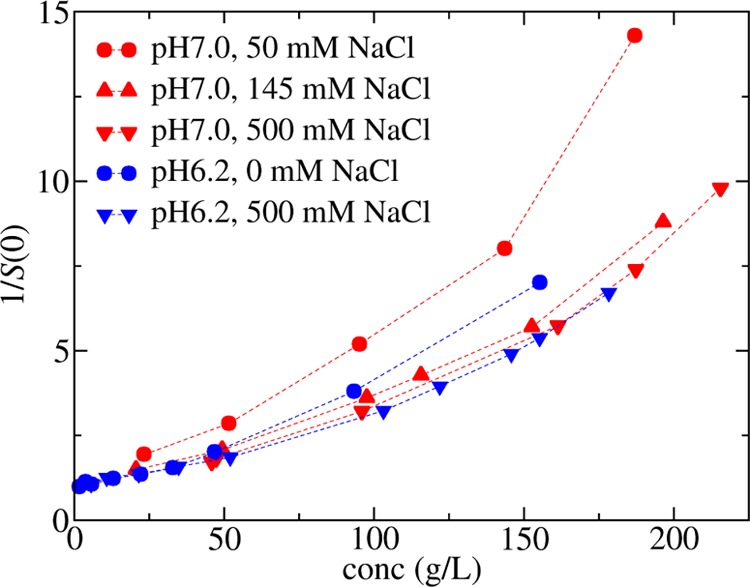
Osmotic compressibility measured using SLS in octanoate_pH7.0 (red symbols) or phosphate_pH6.2 (blue symbols) at different sodium chloride concentrations as denoted in the legend. The lines are drawn as a guide to the eye.

Osmotic compressibility measured using SLS in octanoate_pH7.0 (red symbols) or phosphate_pH6.2 (blue symbols) at different sodium chloride concentrations as denoted in the legend. The lines are drawn as a guide to the eye.