Figure 5.

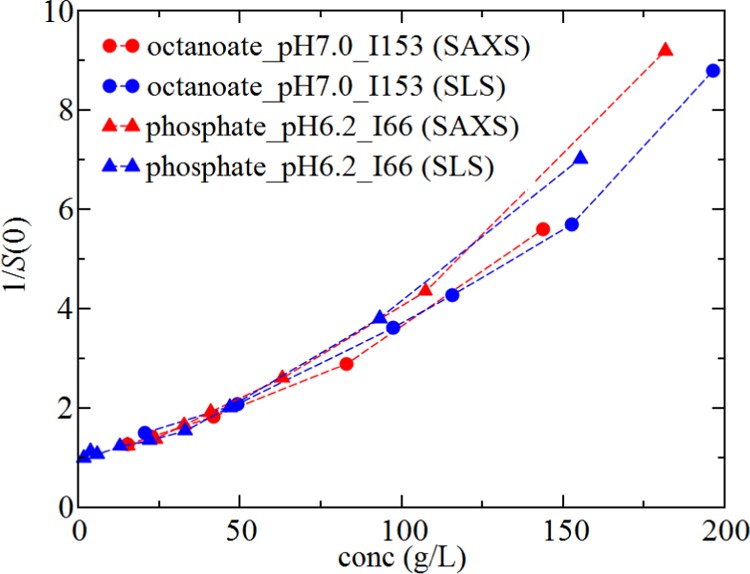
Comparison of osmotic compressibility profiles as a function of rHSA concentration obtained from SAXS (red symbols) to those obtained by SLS (blue symbols) for phosphate_pH6.2_I66 (triangles) or octanoate_pH7.0_I153 (circles).

Comparison of osmotic compressibility profiles as a function of rHSA concentration obtained from SAXS (red symbols) to those obtained by SLS (blue symbols) for phosphate_pH6.2_I66 (triangles) or octanoate_pH7.0_I153 (circles).