
Figure 6.
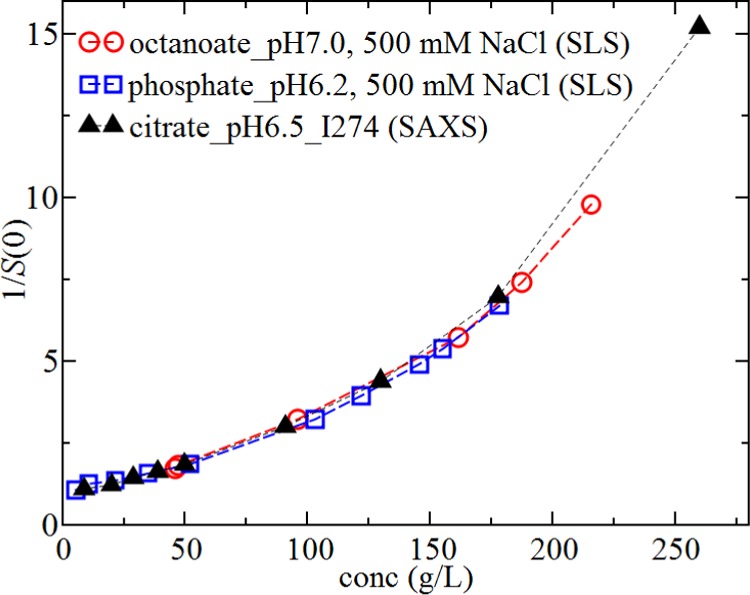
Measured values for S(0)−1 as a function of rHSA concentration obtained from SLS for samples at high salt conditions in phosphate_pH6.2 (blue squares) and octanoate_pH7.0 (red circles) and from SAXS for samples in citrate_pH6.5_I274 (black triangles).