
Figure 8.
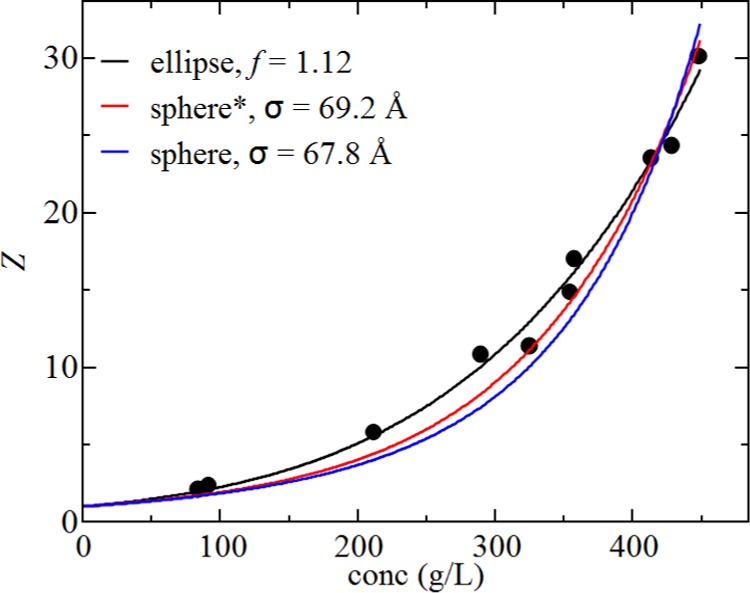
Compressibility factor obtained from the experimental data taken by Vilker et al.69 along with the fits for the ellipsoidal model (black line) and the virial equation of state with either 6 terms (red line, denoted by *) or 10 terms (blue line). Fit parameters are shown in the legend.