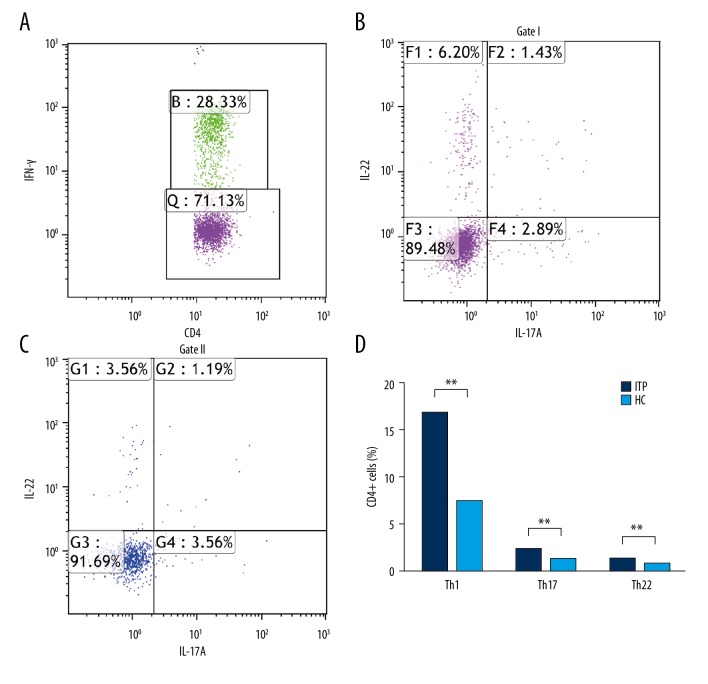
Figure 2.
Percentages of circulating Th1 (IFN-γ+IL-17A−IL-22−), Th1/Th17 (IFN-γ+IL-17A+IL-22−), Th17 (IFN-γ−IL-17A+IL-22−, IFN-γ−IL-17A+IL-22+), and Th22 (IFN-γ−IL-17A−IL-22+) cells on CD4+cells of ITP and HC. (A–C) Representative four-color dot plot analyses of Th1, Th17, Th22, Th1/Th22, and Th1/Th17 cells. (D) Percentages of Th1 (IFN-γ+IL-17A−IL-22−), Th17 (IFN-γ−IL-17A+IL-22−, IFN-γ−IL-17A+IL-22+), and Th22 (IFN-γ−IL-17A−IL-22+) cells, Th1/Th22, and Th1/Th17 cells. Results are represented as the mean ±SD (** p<0.05). ANOVA followed by Tukey’s post hoc test was used to analyze statistical significance.

