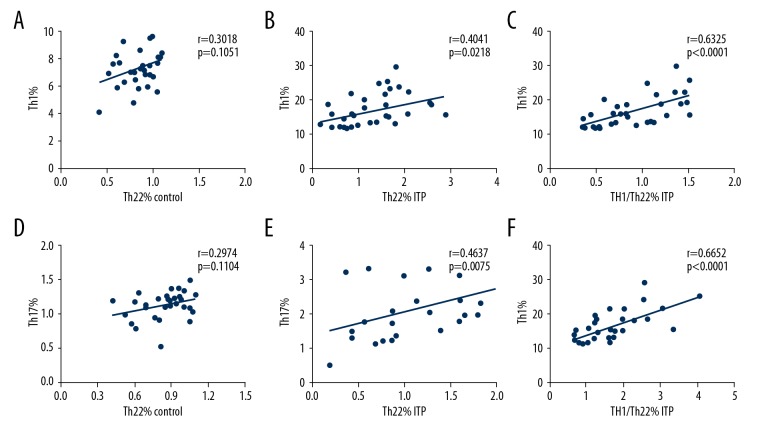
Figure 3.
Correlations between Th22 cells Th17 cells, and Th1 cells in ITP patients. (A, B) A positive correlation was found between Th22 cells and Th1 cells (r=0.4041, p=0.0218) in the ITP patients but not in the controls. (C) A positive correlation was found between Th1/Th22and Th1 cells (r=0.7696, p=0.0002). (D, E) A positive correlation was found between the percentages of Th22 cells and the percentages of Th17 cells in the ITP patients (r=0.4637, p=0.0075) but not in the controls. (F) Th1/Th17 percentage was positively correlated with Th1 percentage (r=0.6652, p<0.0001). The q test was applied to determine the difference between 2 groups. If the data were abnormally distributed, H test and Nemenyi test were used. Correlation analysis depending on data distribution was analyzed by Pearson or Spearman correlation test.

