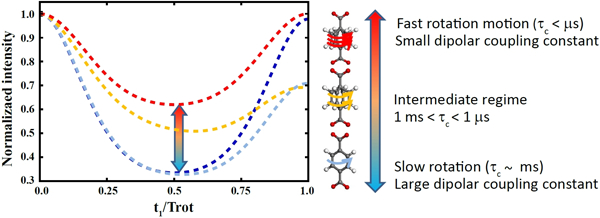
Figure 1. DIPSHIFT curves as a function of dynamic rate on NMR timescale.

The lines are model fits assuming diffusive anisotropic motions under the Anderson-Weiss approximation[28,30] from UiO-66 data at various temperatures (see SI). The curves correspond to estimated correlation times (τc) of ms or the rigid limit (dark blue), ~350 μs (light blue), ~5 μs (yellow), and the fast limit < μs (red). In the present study, DIPSHIFT curves were measured using the pulse sequence shown in Figure S7 and analyzed as explained in the Supporting Information. t1 is the duration of evolution of nuclear spin magnetization under the effect of a combination of 13C-1H dipolar coupling and 13C chemical shift (see Figures S7 and S8) and Trot is the sample rotation period.
