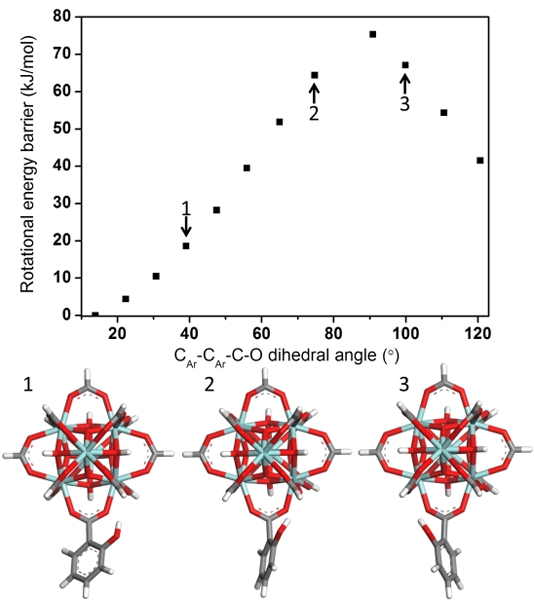
Figure 4. DFT simulation of rotational dynamics in MOFs.

Rotational energy barrier calculation results and snap shot of the model complexes incorporating a single cluster with CAr-CAr-C-O at 40°, 75° and 100°. Coordinates and energies for all models used in the calculations are given in SI.
