
Figure 1. Characterization of Glucose Metabolic Pathways during Human iPSC Differentiation to Hepatocyte-like Cells.
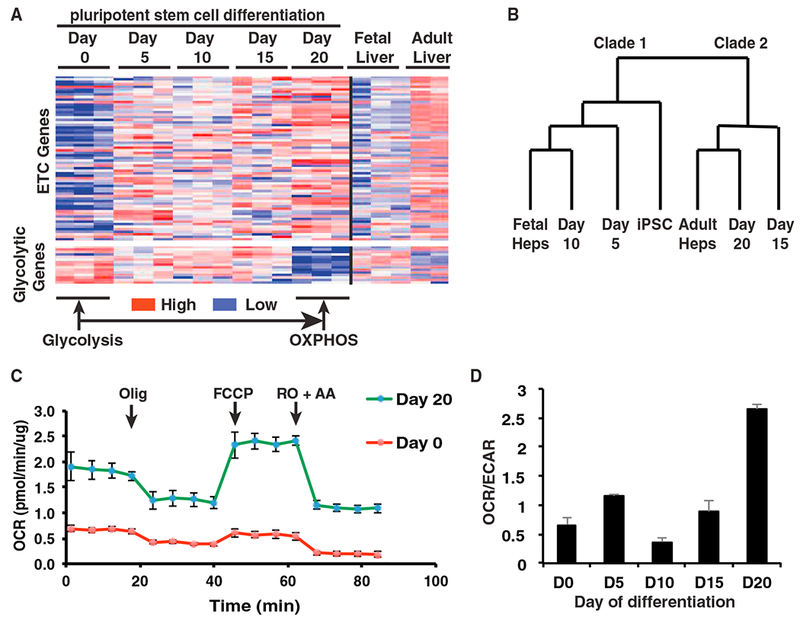
(A) Heatmap showing relative abundance of 82 mRNAs encoding proteins with roles in glucose metabolism (67 electron transport chain genes and 15 glycolytic genes) (n = 3).
(B) Dendrogram representing hierarchical cluster analyses of expression data.
(C) OCR of day 0 iPSCs (red) and day 20 hepatocyte-like cells (green) differentiated from wild-type iPSCs, determined by Seahorse assay (n = 3, mean ± SEM). Olig, oligomycin (1 μM); FCCP, carbonyl cyanide-p-trifluoromethoxyphenylhydrazone (1 μM); RO, rotenone (2 μM); AA, antimycin A (1 μM).
(D) Bar graph showing the ratio of OCR to ECAR during iPSC differentiation as determined by Seahorse assay (n = 3 biological replicates, mean ± SEM).