
Figure 2. Generation of DGUOKΔ14/Δ5 iPSC-Derived Hepatocyte-like Cells.
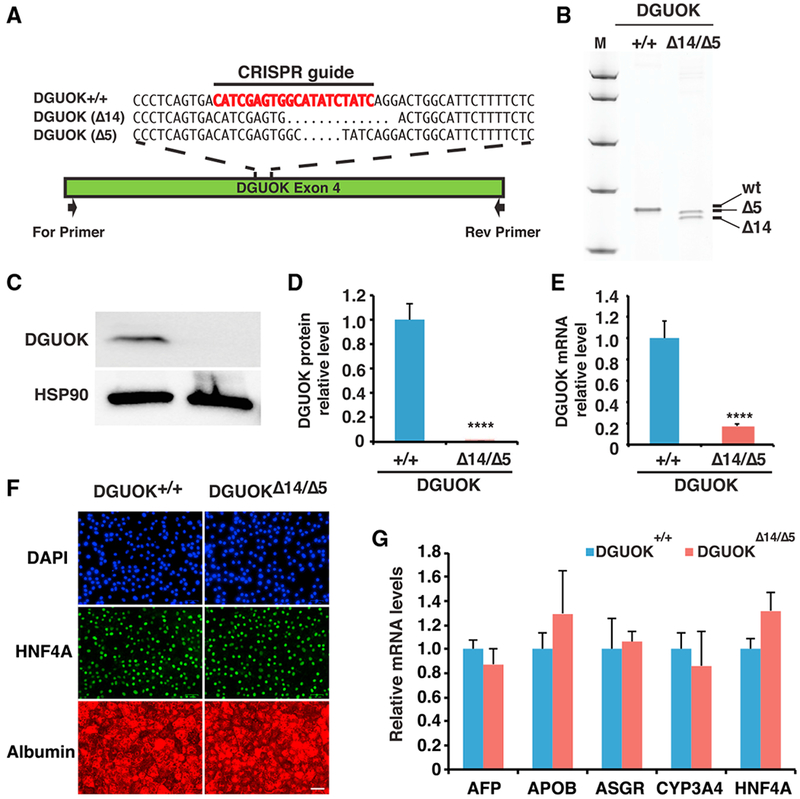
(A) Schematic illustration of DGUOK exon 4 showing the CRISPR/Cas9 guide (red) and nucleotide sequences of DGUOK wild-type (DGUOK+/+) and mutant alleles (DGUOKΔ14/Δ5). Black arrow showing relative position of PCR primers used to identify indels.
(B) Image of the polyacrylamide gel showing DGUOK exon 4 amplicons from control iPSCs (+/+) and iPSCs harboring compound heterozygous deletions of 14 and 5 bp within DGUOK exon 4 (Δ14/Δ5).
(C) Immunoblot to detect DGUOK in either control (+/+) or DGUOKΔ14/Δ5 hepatocytes. HSP90 was used as a loading control.
(D) Quantification of DGUOK protein by densitometry of immunoblots. DGUOK protein was normalized to total protein (n = 3 biological replicates, mean ± SEM, ****p ≤ 0.0001).
(E) Bar graph showing relative steady-state level of DGUOK mRNA in DGUOK+/+ and DGUOKΔ14/Δ5 iPSCs (n = 3 biological replicates, mean ± SEM, ****p ≤ 0.0001).
(F) Representative fluorescent images of DAPI (blue), HNF4A (green), and albumin (red) staining on day 20 wild-type and DGUOKΔ14/Δ5 hepatocyte-like cells. Scale bar, 50 μm.
(G) Bar graph showing relative expression levels of hepatic genes in DGUOK+/+ and DGUOKΔ14/Δ5 hepatocytes at day 20 of differentiation (n = 3 biological replicates, mean ± SEM).