
Figure 7. NR Increases Mitochondrial Activity and ATP Levels in DGUOK-Deficient Rats and RRM2B-Deficient Hepatocyte-like Cells.
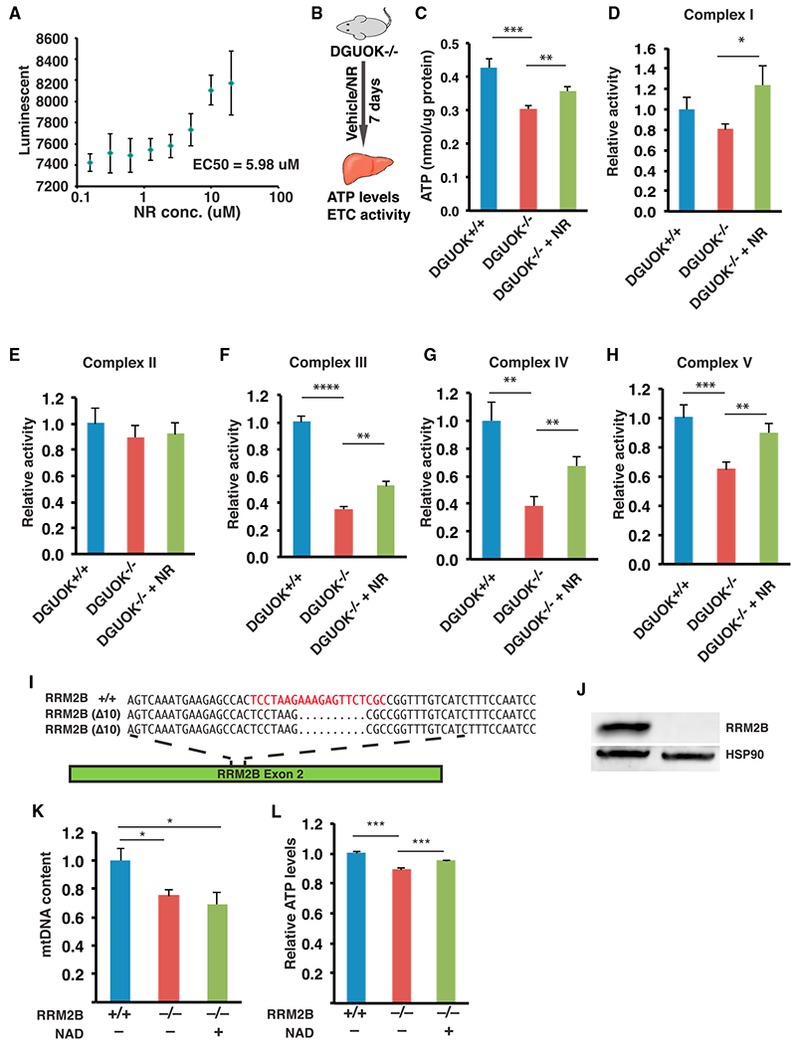
(A) Graph showing the result of a dose-response assay to detect ATP levels (luminescence) in DGUOKΔ14/Δ5 hepatocyte-like cells treated with nicotinamide riboside (NR) at 0.08, 0.16, 0.32, 0.6, 1.25, 2.5, 5, and 10 μM (n = 4 biological replicates, mean ± SEM).
(B) Scheme of experimental approach used to test the effect of NR in DGUOK-deficient rats.
(C–H) Bar graphs showing relative ATP levels (C), and electron transport chain complex I (D), II (E), III (F), IV (G), and V (H) activities in livers from DGUOK+/+ (n = 6, blue) or DGUOK−/− rats without (n = 6, red) or with 500 mg/kg/day NR treatment for 7 days (n = 7, green) (mean ± SEM, **p ≤ 0.01, ***p ≤ 0.001)
(I) Schematic illustration of RRM2B exon 2 showing the CRISPR/Cas9 guide (red) and nucleotide sequences of RRM2B wild-type (RRM2B+/+) and mutant alleles (RRM2BΔ10/Δ10).
(J) Micrograph of an immunoblot to detect expression of RRM2B and HSP90 in RRM2B+/+ and RRM2BΔ10/Δ10 iPSC–derived hepatocytes.
(K) Bar graph showing relative mtDNA content in wild-type cells, untreated RRM2B−/− hepatocyte-like cells, and NAD-treated RRM2B−/− hepatocyte-like cells (n = 6, mean ± SEM, *p ≤ 0.05).
(L) Bar graph showing relative ATP levels in control RRM2B+/+ iPSC-derived hepatocytes and in RRM2B−/− hepatocyte-like cells untreated or treated with 5 mM NAD (n = 12, mean ± SEM, ***p ≤ 0.001).