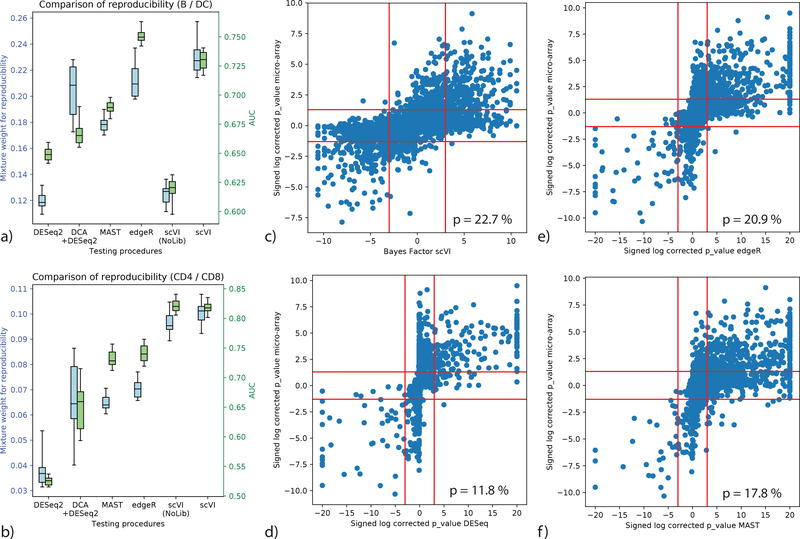
Figure 3:
Benchmark of differential expression analysis using the PBMC dataset (n = 12,039 cells), based on consistency with published bulk data. (a, b) Evaluation of consistency with the irreproducible discovery rate (IDR) [41] framework (blue) and using AUROC (green) is shown for comparisons of B cells vs Dendritic cells (a) and CD4 vs CD8 T cells (b). Error bars are obtained by sub-sampling a hundred cell from each clusters n = 20 times to show robustness. Box plots indicate the median (center lines), interquantile range (hinges) and 5–95th percentiles (whiskers). (c,d,e,f): correlation of significance levels of differential expression of B cells vs Dendritic cells, comparing bulk data and single cell. Points are individual genes (n = 3,346). Bayes factors or BH-corrected p-values on scRNA-seq data are presented on the x-axis; microarray-based BH-corrected p-values are depicted on the y-axis. Horizontal bars denote significance threshold of 0.05 for corrected p-values. Vertical bars denote significance threshold for the Bayes factor of scVI (c) or 0.05 for corrected p-values for DESeq2 (d), edgeR (e), and MAST (f). We also report the median mixture weight for reproducibility p (higher is better).

