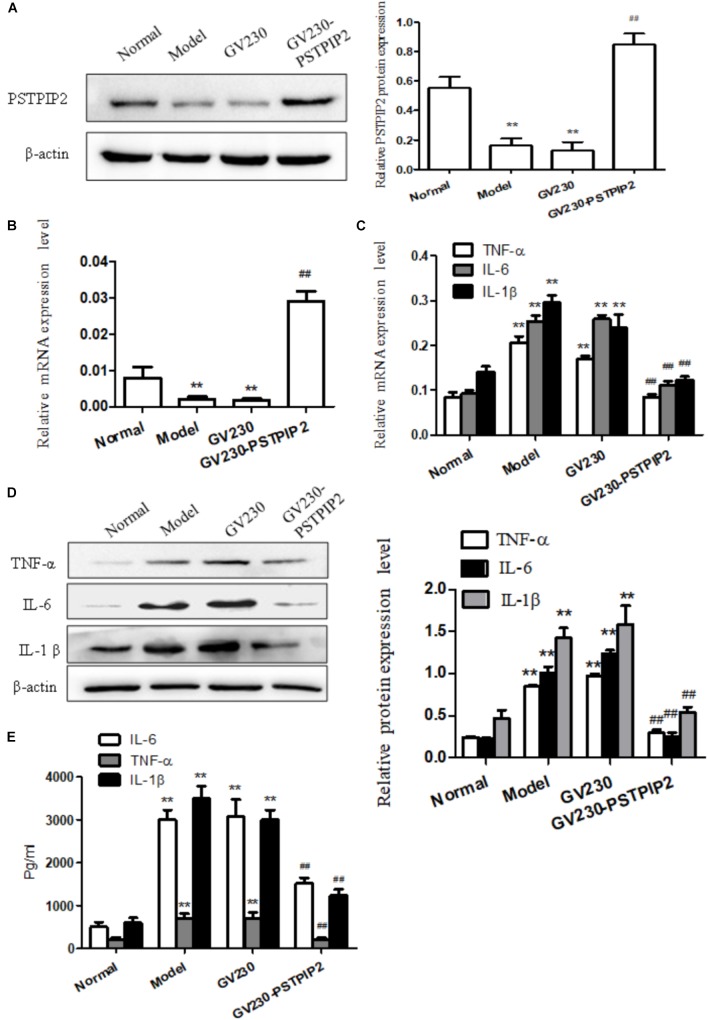
FIGURE 2.
Overexpression of PSTPIP2 suppresses FLSs inflammatory response. (A) The protein level of PSTPIP2 was analyzed by Western blot in FLSs with PSTPIP2 overexpression. (B) The mRNA level of PSTPIP2 was analyzed by qRT-PCR in FLSs with PSTPIP2 overexpression. (C) The mRNA levels of TNF-α, IL-1β, and IL-6 were analyzed by qRT-PCR in FLSs with PSTPIP2 overexpression. (D) The protein levels of TNF-α, IL-1β, and IL-6 were analyzed by Western blot in FLSs with PSTPIP2 overexpression. (E) The levels of TNF-α, IL-1β, and IL-6 in FLSs supernatants were detected by ELISA. The bands or images in the figure are representative in three independent experiments. Data shown are the mean ± SD from three independent experiments. Each group contains 5 rats. ##P < 0.01 versus GV230 group; ∗∗P < 0.01 versus normal group.

