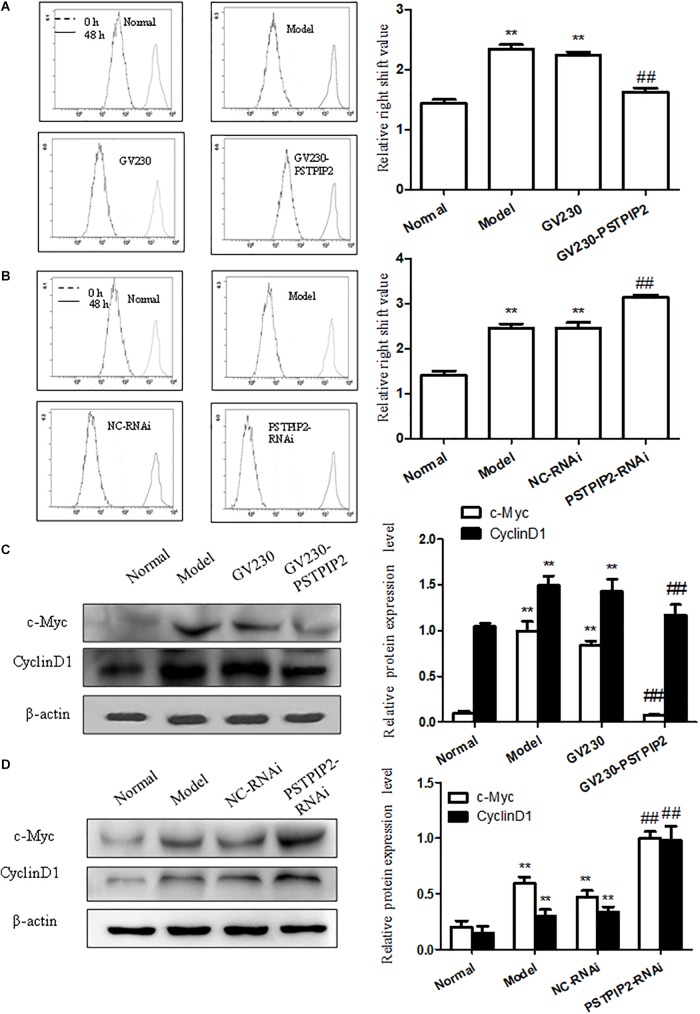
FIGURE 4.
PSTPIP2 suppresses FLSs proliferation. (A) CFDA SE proliferation assay with PSTPIP2 overexpression. (B) CFDA SE proliferation assay with PSTPIP2 silencing. (C) The protein levels of c-Myc and Cyclin D1 were analyzed by Western blot in FLSs with PSTPIP2 overexpression. Representative bands and images of three independent experiments. (D) The protein levels of c-Myc and Cyclin D1 were analyzed by Western blot in FLSs with PSTPIP2 silencing. Each group contains 5 rats. The bands or images in the figure are representative in three independent experiments. Data shown are the mean ± SD from three independent experiments. ##P < 0.01 versus GV230 or NC-RNAi group; ∗∗P < 0.01 versus normal group.

