Figure 1.

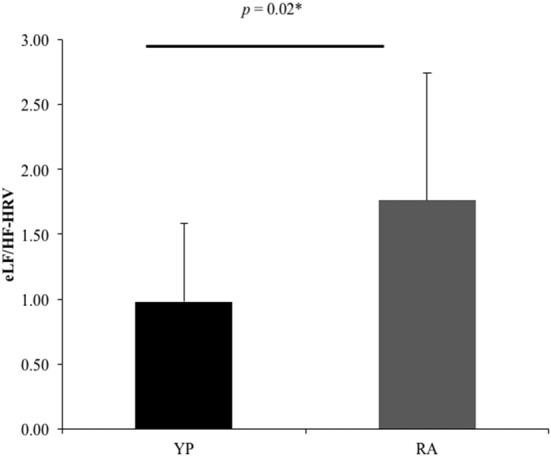
There was a significant difference between groups for the ratio between low-frequency and high frequency-heart rate variability (eLF/HF-HRV; U = 7.57, p = 0.02). *Significant at puncorrected < 0.05.

There was a significant difference between groups for the ratio between low-frequency and high frequency-heart rate variability (eLF/HF-HRV; U = 7.57, p = 0.02). *Significant at puncorrected < 0.05.