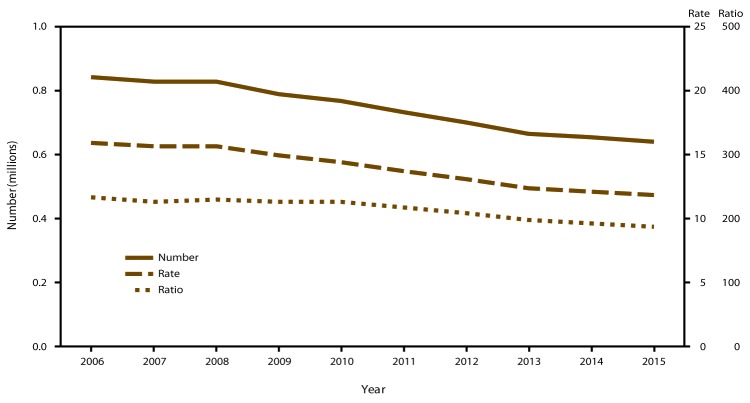
FIGURE 1.
Number, rate,* and ratio† of abortions performed, by year — selected reporting areas,§ United States, 2006–2015
* Number of abortions per 1,000 women aged 15–44 years.
† Number of abortions per 1,000 live births.
§ Data are for 49 reporting areas; excludes California, Maryland, and New Hampshire.

