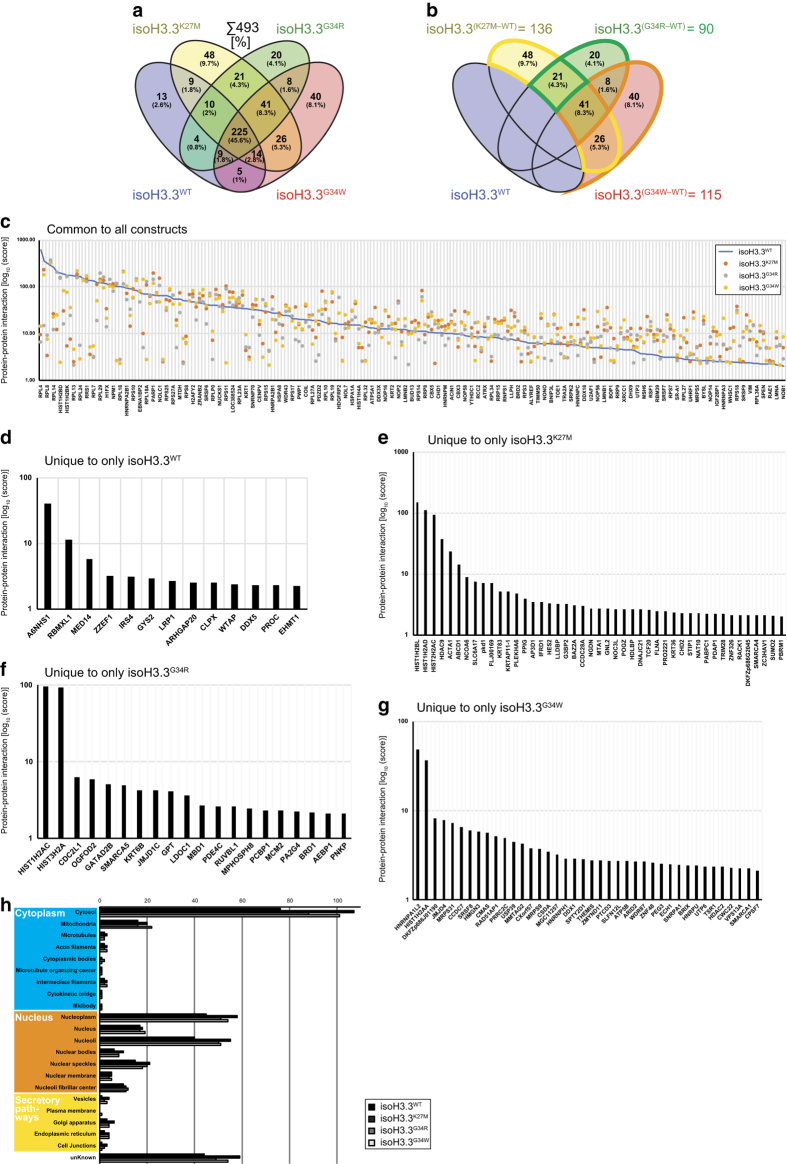
Figure 2. The complete H3.3 interaction proteome of the isogenic cell lines isoH3.3WT, isoH3.3K27M, isoH3.3G34R, and isoH3.3G34W.
(a) Venn diagram indicating the grand total of 493 proteins in the H3.3 interactome. (b) Venn diagram indicating number of proteins specific to each construct when excluding isoH3.3WT. (c) Plot showing protein-protein interaction score from the H3.3 interactome when compared to isoH3.3WT (blue line). (d-g) Proteins uniquely identified from the individual isoH3.3 mutant lines, with corresponding protein-protein interaction scores. (h) Distribution of protein compartmentalization based on proteinatlas.org subcellular location data.

